Blackberry 2015 Annual Report Download - page 106
Download and view the complete annual report
Please find page 106 of the 2015 Blackberry annual report below. You can navigate through the pages in the report by either clicking on the pages listed below, or by using the keyword search tool below to find specific information within the annual report.
BlackBerry Limited
Notes to the Consolidated Financial Statements
In millions of United States dollars, except share and per share data, and except as otherwise indicated
31
trustee purchased nil and sold 6,032,719 common shares for consideration of approximately $61 million (March 1, 2014 -
1,641,447 common shares were purchased for total cash consideration of approximately $16 million), which was remitted
to the Company as a return of contributions. With the sale, the trustee no longer holds shares, and the Company expects to
settle vested RSUs by issuing new common shares from treasury.
As at February 28, 2015, there was $153 million of unrecognized compensation expense related to RSUs that will be
expensed over the vesting period, which, on a weighted-average basis, results in a period of approximately 1.86 years.
During the year ended February 28, 2015, there were 9,530,093 RSUs granted (March 1, 2014 - 21,741,154), all of which
when vested will be settled with the issuance of new common shares of the Company.
Deferred Share Units
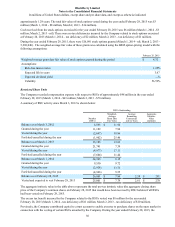
The Company issued 108,954 DSUs in the year ended February 28, 2015. There were 0.3 million DSUs outstanding as at
February 28, 2015 (March 1, 2014 - 0.2 million). The Company had a liability of $3.3 million in relation to the DSU Plan
as at February 28, 2015 (March 1, 2014 - $2.4 million).
12. EARNINGS (LOSS) PER SHARE
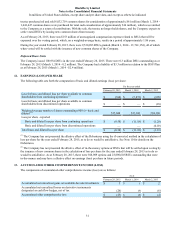
The following table sets forth the computation of basic and diluted earnings (loss) per share:
For the year ended
February 28, 2015 March 1, 2014 March 2, 2013
Loss for basic and diluted loss per share available to common
shareholders from continuing operations (1) $(304) $ (5,873) $ (628)
Loss for basic and diluted loss per share available to common
shareholders from discontinued operations $ — $ — $ (18)
Weighted-average number of shares outstanding (000’s) - basic and
diluted (2) 527,684 525,168 524,160
Loss per share - reported
Basic and diluted loss per share from continuing operations $(0.58) $ (11.18) $ (1.20)
Basic and diluted loss per share from discontinued operations — — (0.03)
Total basic and diluted loss per share $(0.58) $ (11.18) $ (1.23)
(1) The Company has not presented the dilutive effect of the Debentures using the if-converted method in the calculation of
loss per share for the year ended February 28, 2015, as to do so would be antidilutive. See Note 10 for details on the
Debentures.
(2) The Company has not presented the dilutive effect of in-the-money options or RSUs that will be settled upon vesting by
the issuance of new common shares in the calculation of loss per share for the year ended February 28, 2015 as to do so
would be antidilutive. As at February 28, 2015, there were 928,909 options and 23,890,603 RSUs outstanding that were
in-the-money and may have a dilutive effect on earnings (loss) per share in future periods.
13. ACCUMULATED OTHER COMPREHENSIVE INCOME (LOSS)
The components of accumulated other comprehensive income (loss) are as follows:
As at
February 28, 2015 March 1, 2014 March 2, 2013
Accumulated net unrealized gains on available-for-sale investments $ 3 $ 1 $ 2
Accumulated net unrealized losses on derivative instruments
designated as cash flow hedges, net of tax (26)(9) (6)
Accumulated other comprehensive loss $(23)$ (8) $(4)


