Blackberry 2015 Annual Report Download - page 105
Download and view the complete annual report
Please find page 105 of the 2015 Blackberry annual report below. You can navigate through the pages in the report by either clicking on the pages listed below, or by using the keyword search tool below to find specific information within the annual report.-
 1
1 -
2
-
3
-
4
-
5
-
6
-
7
-
8
-
9
-
10
-
11
-
12
-
13
-
14
-
15
-
16
-
17
-
18
-
19
-
20
-
21
-
22
-
23
-
24
-
25
-
26
-
27
-
28
-
29
-
30
-
31
-
32
-
33
-
34
-
35
-
36
-
37
-
38
-
39
-
40
-
41
-
42
-
43
-
44
-
45
-
46
-
47
-
48
-
49
-
50
-
51
-
52
-
53
-
54
-
55
-
56
-
57
-
58
-
59
-
60
-
61
-
62
-
63
-
64
-
65
-
66
-
67
-
68
-
69
-
70
-
71
-
72
-
73
-
74
-
75
-
76
-
77
-
78
-
79
-
80
-
81
-
82
-
83
-
84
-
85
-
86
-
87
-
88
-
89
-
90
-
91
-
92
-
93
-
94
-
 95
95 -
 96
96 -
 97
97 -
 98
98 -
 99
99 -
 100
100 -
 101
101 -
 102
102 -
 103
103 -
 104
104 -
 105
105 -
 106
106 -
 107
107 -
 108
108 -
 109
109 -
 110
110 -
 111
111 -
 112
112 -
 113
113 -
 114
114 -
 115
115 -
116
-
117
-
118
-
119
-
120
-
121
-
122
-
123
-
124
-
125
-
126
-
127
-
128
-
129
-
130
-
131
-
132
-
133
-
134
-
135
-
136
-
137
-
138
-
139
-
140
-
141
-
142
-
143
-
144
-
145
-
146
-
147
-
148
-
149
-
150
-
151
-
152
-
153
-
154
-
155
-
156
-
157
-
158
-
159
-
160
-
161
-
162
-
163
-
164
-
165
-
166
-
167
-
168
-
169
-
170
-
171
-
172
-
173
-
174
-
175
-
176
-
177
-
178
-
179
-
180
-
181
-
182
-
183
-
184
-
185
-
186
-
187
-
188
-
189
-
190
-
191
-
192
-
193
-
194
-
195
-
196
-
197
-
198
-
199
-
200
-
201
-
202
-
203
-
204
-
205
-
206
-
207
-
208
-
209
-
210
-
211
-
212
-
213
-
214
-
215
-
216
-
217
-
218
 |
 |

BlackBerry Limited
Notes to the Consolidated Financial Statements
In millions of United States dollars, except share and per share data, and except as otherwise indicated
30
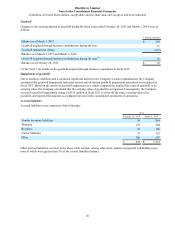
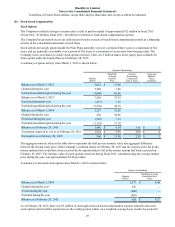
approximately 1.29 years. The total fair value of stock options vested during the year ended February 28, 2015 was $3
million (March 1, 2014 - $8 million, March 2, 2013 - $14 million).
Cash received from the stock options exercised for the year ended February 28, 2015 was $6 million (March 1, 2014 - $3
million; March 2, 2013 - nil). There were no tax deficiencies incurred by the Company related to stock options exercised
at February 28, 2015 (March 1, 2014 – tax deficiency of $2 million; March 2, 2013 – tax deficiency of $1 million).
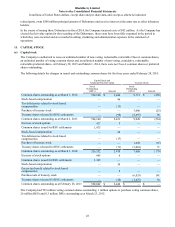
During the year ended February 28, 2015, there were 526,091 stock options granted (March 1, 2014 - nil; March 2, 2013 -
5,288,040). The weighted-average fair value of these grants was calculated using the BSM option-pricing model with the
following assumptions:
February 28, 2015
Weighted-average grant date fair value of stock options granted during the period $ 4.32
Assumptions:
Risk-free interest rates 1.25%
Expected life in years 3.67
Expected dividend yield —%
Volatility 56.59%
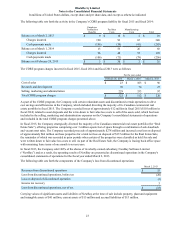
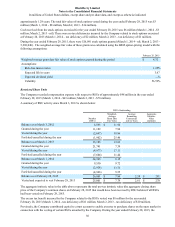
Restricted Share Units
The Company recorded compensation expense with respect to RSUs of approximately $48 million in the year ended
February 28, 2015 (March 1, 2014 - $63 million; March 2, 2013 - $78 million).
A summary of RSU activity since March 3, 2012 is shown below:
RSUs Outstanding
Number
(000’s)
Weighted-
Average
Grant Date
Fair Value
Average
Remaining
Contractual
Life in Years
Aggregate
Intrinsic
Value
(millions)
Balance as at March 3, 2012 8,595 $ 31.96
Granted during the year 11,189 7.94
Vested during the year (2,697) 38.96
Forfeited/cancelled during the year (1,902) 25.46
Balance as at March 2, 2013 15,185 13.83
Granted during the year 21,741 7.39
Vested during the year (4,977) 17.11
Forfeited/cancelled during the year (7,604) 11.44
Balance as at March 1, 2014 24,345 8.15
Granted during the year 9,530 9.72
Vested during the year (2,928) 13.73
Forfeited/cancelled during the year (4,946) 9.55
Balance as at February 28, 2015 26,001 $ 7.84 2.58 $ 281
Vested and expected to vest February 28, 2015 25,001 $ 7.79 2.61 $ 270
The aggregate intrinsic value in the table above represents the total pre-tax intrinsic value (the aggregate closing share
price of the Company’s common shares on February 28, 2015 that would have been received by RSU holders if all RSUs
had been vested on February 28, 2015.
The excess tax benefit incurred by the Company related to the RSUs vested was $8 million for the year ended
February 28, 2015 (March 1, 2014 - tax deficiency of $11 million; March 2, 2013 - tax deficiency of $10 million).
Previously, the Company contributed capital to a trust account to enable a trustee to purchase shares on the open market in
connection with the vesting of certain RSUs awarded by the Company. During the year ended February 28, 2015, the