Blackberry 2015 Annual Report Download - page 140
Download and view the complete annual report
Please find page 140 of the 2015 Blackberry annual report below. You can navigate through the pages in the report by either clicking on the pages listed below, or by using the keyword search tool below to find specific information within the annual report.-
 1
1 -
2
-
3
-
4
-
5
-
6
-
7
-
8
-
9
-
10
-
11
-
12
-
13
-
14
-
15
-
16
-
17
-
18
-
19
-
20
-
21
-
22
-
23
-
24
-
25
-
26
-
27
-
28
-
29
-
30
-
31
-
32
-
33
-
34
-
35
-
36
-
37
-
38
-
39
-
40
-
41
-
42
-
43
-
44
-
45
-
46
-
47
-
48
-
49
-
50
-
51
-
52
-
53
-
54
-
55
-
56
-
57
-
58
-
59
-
60
-
61
-
62
-
63
-
64
-
65
-
66
-
67
-
68
-
69
-
70
-
71
-
72
-
73
-
74
-
75
-
76
-
77
-
78
-
79
-
80
-
81
-
82
-
83
-
84
-
85
-
86
-
87
-
88
-
89
-
90
-
91
-
92
-
93
-
94
-
95
-
96
-
97
-
98
-
99
-
100
-
101
-
102
-
103
-
104
-
105
-
106
-
107
-
108
-
109
-
110
-
111
-
112
-
113
-
114
-
115
-
116
-
117
-
118
-
119
-
120
-
121
-
122
-
123
-
124
-
125
-
126
-
127
-
128
-
129
-
 130
130 -
 131
131 -
 132
132 -
 133
133 -
 134
134 -
 135
135 -
 136
136 -
 137
137 -
 138
138 -
 139
139 -
 140
140 -
 141
141 -
 142
142 -
 143
143 -
 144
144 -
 145
145 -
 146
146 -
 147
147 -
 148
148 -
 149
149 -
 150
150 -
151
-
152
-
153
-
154
-
155
-
156
-
157
-
158
-
159
-
160
-
161
-
162
-
163
-
164
-
165
-
166
-
167
-
168
-
169
-
170
-
171
-
172
-
173
-
174
-
175
-
176
-
177
-
178
-
179
-
180
-
181
-
182
-
183
-
184
-
185
-
186
-
187
-
188
-
189
-
190
-
191
-
192
-
193
-
194
-
195
-
196
-
197
-
198
-
199
-
200
-
201
-
202
-
203
-
204
-
205
-
206
-
207
-
208
-
209
-
210
-
211
-
212
-
213
-
214
-
215
-
216
-
217
-
218
 |
 |
BlackBerry Limited
Management’s Discussion and Analysis of Financial Condition and Results of Operations
29
sale of certain investments, and increases in the Company's average cash and investment balances, which were partially offset
by interest costs associated with the Debentures. See “Financial Condition - Liquidity and Capital Resources” below.
Income Taxes
For the fourth quarter of fiscal 2015, the Company’s net effective income tax expense rate was approximately 2900%,
compared to approximately 24% for the same period in the prior fiscal year. The Company’s net effective income tax recovery
rate reflects the fact that the Company expects an income tax recovery of its cash tax paid in fiscal 2012 due to an anticipated
loss carryback of its fiscal 2015 anticipated tax loss. That current tax recovery will be limited to fiscal 2012 cash tax paid not
previously recovered. The Company’s income tax recovery rate also reflects the fact that the Company has a significant
valuation allowance in place against its deferred tax assets, and in particular, due to this valuation allowance, the significant
income statement impact of the Debentures fair value was offset by a corresponding adjustment of the valuation allowance. The
Company’s net effective income tax recovery rate also reflects the geographic mix of earnings in jurisdictions with different
income tax rates. See also “Results of Operations - Fiscal year ended February 28, 2015 compared to fiscal year ended
March 1, 2014 - Income Taxes - RSU Trust Share Sale” in this MD&A.
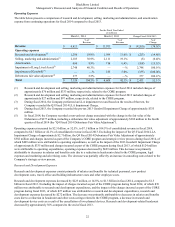
Net Income
The Company’s net income for the fourth quarter of fiscal 2015 was $28 million, or $0.05 basic and diluted earnings per share
on a GAAP basis, reflecting an increase in net income of $451 million compared to a net loss from continuing operations of
$423 million, or $0.80 basic and diluted loss per share, in the fourth quarter of fiscal 2014. Excluding the impact of the relevant
Q4 Fiscal 2015 Non-GAAP Adjustments and Q4 Fiscal 2014 Non-GAAP Adjustments, the Company's net income was $20
million compared to a net loss of $42 million, reflecting an increase in net income of $62 million due to a reduction in
operating expenditures, which was partially offset by decreases in the recovery of income taxes and the Company's gross
margin.
The weighted average number of shares outstanding was 529 million common shares for basic earnings per share and 544
million common shares for diluted earnings per share for the fourth quarter of fiscal 2015. The weighted average number of
shares outstanding was 526 million common shares for basic and diluted loss per share for the fourth quarter of fiscal 2014.