Blackberry 2015 Annual Report Download - page 86
Download and view the complete annual report
Please find page 86 of the 2015 Blackberry annual report below. You can navigate through the pages in the report by either clicking on the pages listed below, or by using the keyword search tool below to find specific information within the annual report.-
 1
1 -
2
-
3
-
4
-
5
-
6
-
7
-
8
-
9
-
10
-
11
-
12
-
13
-
14
-
15
-
16
-
17
-
18
-
19
-
20
-
21
-
22
-
23
-
24
-
25
-
26
-
27
-
28
-
29
-
30
-
31
-
32
-
33
-
34
-
35
-
36
-
37
-
38
-
39
-
40
-
41
-
42
-
43
-
44
-
45
-
46
-
47
-
48
-
49
-
50
-
51
-
52
-
53
-
54
-
55
-
56
-
57
-
58
-
59
-
60
-
61
-
62
-
63
-
64
-
65
-
66
-
67
-
68
-
69
-
70
-
71
-
72
-
73
-
74
-
75
-
 76
76 -
 77
77 -
 78
78 -
 79
79 -
 80
80 -
 81
81 -
 82
82 -
 83
83 -
 84
84 -
 85
85 -
 86
86 -
 87
87 -
 88
88 -
 89
89 -
 90
90 -
 91
91 -
 92
92 -
 93
93 -
 94
94 -
 95
95 -
 96
96 -
97
-
98
-
99
-
100
-
101
-
102
-
103
-
104
-
105
-
106
-
107
-
108
-
109
-
110
-
111
-
112
-
113
-
114
-
115
-
116
-
117
-
118
-
119
-
120
-
121
-
122
-
123
-
124
-
125
-
126
-
127
-
128
-
129
-
130
-
131
-
132
-
133
-
134
-
135
-
136
-
137
-
138
-
139
-
140
-
141
-
142
-
143
-
144
-
145
-
146
-
147
-
148
-
149
-
150
-
151
-
152
-
153
-
154
-
155
-
156
-
157
-
158
-
159
-
160
-
161
-
162
-
163
-
164
-
165
-
166
-
167
-
168
-
169
-
170
-
171
-
172
-
173
-
174
-
175
-
176
-
177
-
178
-
179
-
180
-
181
-
182
-
183
-
184
-
185
-
186
-
187
-
188
-
189
-
190
-
191
-
192
-
193
-
194
-
195
-
196
-
197
-
198
-
199
-
200
-
201
-
202
-
203
-
204
-
205
-
206
-
207
-
208
-
209
-
210
-
211
-
212
-
213
-
214
-
215
-
216
-
217
-
218
 |
 |

BlackBerry Limited
Notes to the Consolidated Financial Statements
In millions of United States dollars, except share and per share data, and except as otherwise indicated
11
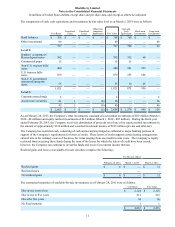
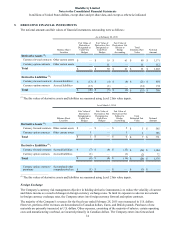
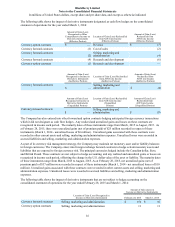
The components of cash, cash equivalents and investments by fair value level as at March 1, 2014 were as follows:
Cost Basis Unrealized
Gains Unrealized
Losses
Other-than-
temporary
Impairment Fair Value
Cash and
Cash
Equivalents Short-term
Investments Long-term
Investments
Bank balances $ 708 $ — $ — $ — $ 708 $ 708 $ — $ —
Other investments 89———89——89
797 — — — 797 708 — 89
Level 2:
Bankers’ acceptances/
Bearer deposit notes 392 — — — 392 332 60 —
Commercial paper 15———1515——
Non-U.S. treasury bills/
notes 480 — — — 480 241 239 —
U.S. treasury bills/
notes 879 — — — 879 253 626 —
Non-U.S. government
sponsored enterprise
notes 55———553025—
1,821 — — — 1,821 871 950 —
Level 3:
Corporate notes/bonds 4——— 4—— 4
Auction rate securities 41 1 — (6) 36 — — 36
45 1 — (6) 40 — — 40
$ 2,663 $ 1 $ — $ (6) $ 2,658 $ 1,579 $ 950 $ 129
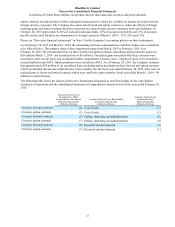
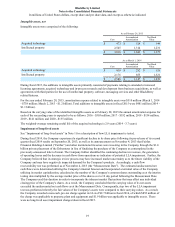
As at February 28, 2015, the Company’s other investments consisted of cost method investments of $52 million (March 1,
2014 - $4 million) and equity method investments of $14 million (March 1, 2014 - $85 million). During the fiscal year
ended February 28, 2015, the Company received a distribution of proceeds out of one of its equity method investments in
the amount of approximately $134 million and recorded investment income of $115 million (pre-tax and after-tax).
The Company has restricted cash, consisting of cash and securities pledged as collateral to major banking partners in
support of the Company's requirements for letters of credit. These letters of credit support certain leasing arrangements
entered into in the ordinary course of business, for terms ranging from one month to nine years. The Company is legally
restricted from accessing these funds during the term of the leases for which the letters of credit have been issued;
however, the Company can continue to invest the funds and receive investment income thereon.
Realized gains and losses on available-for-sale securities comprise the following:
For the year ended
February 28, 2015 March 1, 2014 March 2, 2013
Realized gains $ 6 $ — $ 11
Realized losses ———
Net realized gains $ 6 $ — $ 11
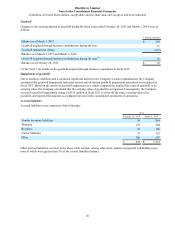
The contractual maturities of available-for-sale investments as at February 28, 2015 were as follows:
Cost Basis Fair Value
Due in one year or less $ 2,124 $ 2,125
Due in one to five years 213 213
Due after five years 94 96
No fixed maturity 1 1
$ 2,432 $ 2,435