Blackberry 2015 Annual Report Download - page 129
Download and view the complete annual report
Please find page 129 of the 2015 Blackberry annual report below. You can navigate through the pages in the report by either clicking on the pages listed below, or by using the keyword search tool below to find specific information within the annual report.-
 1
1 -
2
-
3
-
4
-
5
-
6
-
7
-
8
-
9
-
10
-
11
-
12
-
13
-
14
-
15
-
16
-
17
-
18
-
19
-
20
-
21
-
22
-
23
-
24
-
25
-
26
-
27
-
28
-
29
-
30
-
31
-
32
-
33
-
34
-
35
-
36
-
37
-
38
-
39
-
40
-
41
-
42
-
43
-
44
-
45
-
46
-
47
-
48
-
49
-
50
-
51
-
52
-
53
-
54
-
55
-
56
-
57
-
58
-
59
-
60
-
61
-
62
-
63
-
64
-
65
-
66
-
67
-
68
-
69
-
70
-
71
-
72
-
73
-
74
-
75
-
76
-
77
-
78
-
79
-
80
-
81
-
82
-
83
-
84
-
85
-
86
-
87
-
88
-
89
-
90
-
91
-
92
-
93
-
94
-
95
-
96
-
97
-
98
-
99
-
100
-
101
-
102
-
103
-
104
-
105
-
106
-
107
-
108
-
109
-
110
-
111
-
112
-
113
-
114
-
115
-
116
-
117
-
118
-
 119
119 -
 120
120 -
 121
121 -
 122
122 -
 123
123 -
 124
124 -
 125
125 -
 126
126 -
 127
127 -
 128
128 -
 129
129 -
 130
130 -
 131
131 -
 132
132 -
 133
133 -
 134
134 -
 135
135 -
 136
136 -
 137
137 -
 138
138 -
 139
139 -
140
-
141
-
142
-
143
-
144
-
145
-
146
-
147
-
148
-
149
-
150
-
151
-
152
-
153
-
154
-
155
-
156
-
157
-
158
-
159
-
160
-
161
-
162
-
163
-
164
-
165
-
166
-
167
-
168
-
169
-
170
-
171
-
172
-
173
-
174
-
175
-
176
-
177
-
178
-
179
-
180
-
181
-
182
-
183
-
184
-
185
-
186
-
187
-
188
-
189
-
190
-
191
-
192
-
193
-
194
-
195
-
196
-
197
-
198
-
199
-
200
-
201
-
202
-
203
-
204
-
205
-
206
-
207
-
208
-
209
-
210
-
211
-
212
-
213
-
214
-
215
-
216
-
217
-
218
 |
 |

BlackBerry Limited
Management’s Discussion and Analysis of Financial Condition and Results of Operations
18
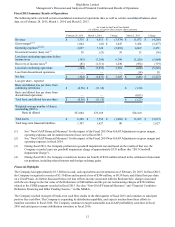
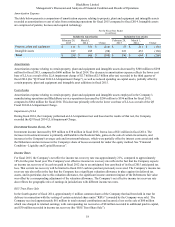
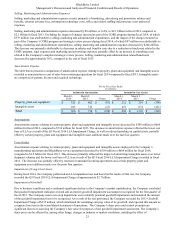
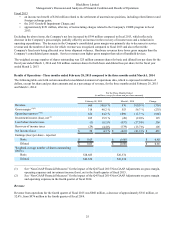
Amortization Expense
The table below presents a comparison of amortization expense relating to property, plant and equipment and intangible assets
recorded as amortization or cost of sales from continuing operations for fiscal 2015 compared to fiscal 2014. Intangible assets
are comprised of patents, licenses and acquired technology.
For the Fiscal Year Ended
(in millions)
Included in Amortization Included in Cost of sales
February 28,
2015 March 1,
2014 Change February 28,
2015 March 1,
2014 Change
Property, plant and equipment $ 111 $ 321 $ (210) $ 73 $ 211 $ (138)
Intangible assets 187 285 (98) 323 453 (130)
Total $ 298 $ 606 $ (308) $ 396 $ 664 $ (268)
Amortization
Amortization expense relating to certain property, plant and equipment and intangible assets decreased by $308 million to $298
million for fiscal 2015, compared to $606 million for fiscal 2014. The decrease in amortization expense reflects the lower cost
base of LLA as a result of the LLA impairment charge of $2.7 billion ($2.5 billion after tax) recorded in the third quarter of
fiscal 2014 (the “Q3 Fiscal 2014 LLA Impairment Charge”), as well as reduced spending on capital assets, partially offset by
certain property, plant and equipment and intangible asset additions in fiscal 2015.
Cost of sales
Amortization expense relating to certain property, plant and equipment and intangible assets employed in the Company’s
manufacturing operations and BlackBerry service operations decreased by $268 million to $396 million for fiscal 2015,
compared to $664 million for fiscal 2014. This decrease primarily reflects the lower cost base of LLA as a result of the Q3
Fiscal 2014 LLA Impairment Charge.
Impairment of LLA
During fiscal 2014, the Company performed an LLA impairment test and based on the results of that test, the Company
recorded the Q3 Fiscal 2014 LLA Impairment Charge.
Investment Income (Loss), Net
Investment income increased by $59 million to $38 million in fiscal 2015, from a loss of $21 million in fiscal 2014. The
increase in investment income is primarily attributable to the Rockstar Sale, gains on the sale of certain investments, and
increases in the Company's average cash and investment balances, which were partially offset by interest costs associated with
the Debentures and an increase in the Company's share of losses accounted for under the equity method. See “Financial
Condition - Liquidity and Capital Resources”.
Income Taxes
For fiscal 2015, the Company’s net effective income tax recovery rate was approximately 21%, compared to approximately
18% for the prior fiscal year. The Company's net effective income tax recovery rate reflects the fact that the Company expects
an income tax recovery of its cash tax paid in fiscal 2012 due to an anticipated loss carryback of its fiscal 2015 anticipated tax
loss. That current tax recovery will be limited to fiscal 2012 cash tax paid not previously recovered. The Company’s income tax
recovery rate also reflects the fact that the Company has a significant valuation allowance in place against its deferred tax
assets, and in particular, due to this valuation allowance, the significant income statement impact of the Debentures fair value
was offset by a corresponding adjustment of the valuation allowance. The Company’s net effective income tax recovery rate
also reflects the geographic mix of earnings in jurisdictions with different income tax rates.
RSU Trust Share Sale
In the fourth quarter of fiscal 2014, approximately 6 million common shares of the Company that had been held in trust for
delivery in connection with the vesting of certain restricted share units (“RSUs”) awarded by the Company were sold. The
Company received approximately $61 million in total returned contributions and incurred a loss on the sale of $80 million
which was charged to retained earnings, with corresponding tax recoveries of $8 million recorded in additional paid in capital,
and $30 million recorded in income tax recovery (the “RSU Trust Share Sale”).