Blackberry 2015 Annual Report Download - page 141
Download and view the complete annual report
Please find page 141 of the 2015 Blackberry annual report below. You can navigate through the pages in the report by either clicking on the pages listed below, or by using the keyword search tool below to find specific information within the annual report.-
 1
1 -
2
-
3
-
4
-
5
-
6
-
7
-
8
-
9
-
10
-
11
-
12
-
13
-
14
-
15
-
16
-
17
-
18
-
19
-
20
-
21
-
22
-
23
-
24
-
25
-
26
-
27
-
28
-
29
-
30
-
31
-
32
-
33
-
34
-
35
-
36
-
37
-
38
-
39
-
40
-
41
-
42
-
43
-
44
-
45
-
46
-
47
-
48
-
49
-
50
-
51
-
52
-
53
-
54
-
55
-
56
-
57
-
58
-
59
-
60
-
61
-
62
-
63
-
64
-
65
-
66
-
67
-
68
-
69
-
70
-
71
-
72
-
73
-
74
-
75
-
76
-
77
-
78
-
79
-
80
-
81
-
82
-
83
-
84
-
85
-
86
-
87
-
88
-
89
-
90
-
91
-
92
-
93
-
94
-
95
-
96
-
97
-
98
-
99
-
100
-
101
-
102
-
103
-
104
-
105
-
106
-
107
-
108
-
109
-
110
-
111
-
112
-
113
-
114
-
115
-
116
-
117
-
118
-
119
-
120
-
121
-
122
-
123
-
124
-
125
-
126
-
127
-
128
-
129
-
130
-
 131
131 -
 132
132 -
 133
133 -
 134
134 -
 135
135 -
 136
136 -
 137
137 -
 138
138 -
 139
139 -
 140
140 -
 141
141 -
 142
142 -
 143
143 -
 144
144 -
 145
145 -
 146
146 -
 147
147 -
 148
148 -
 149
149 -
 150
150 -
 151
151 -
152
-
153
-
154
-
155
-
156
-
157
-
158
-
159
-
160
-
161
-
162
-
163
-
164
-
165
-
166
-
167
-
168
-
169
-
170
-
171
-
172
-
173
-
174
-
175
-
176
-
177
-
178
-
179
-
180
-
181
-
182
-
183
-
184
-
185
-
186
-
187
-
188
-
189
-
190
-
191
-
192
-
193
-
194
-
195
-
196
-
197
-
198
-
199
-
200
-
201
-
202
-
203
-
204
-
205
-
206
-
207
-
208
-
209
-
210
-
211
-
212
-
213
-
214
-
215
-
216
-
217
-
218
 |
 |

BlackBerry Limited
Management’s Discussion and Analysis of Financial Condition and Results of Operations
30
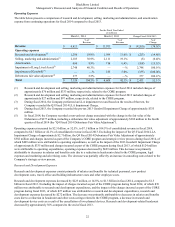
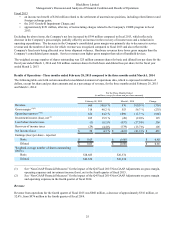
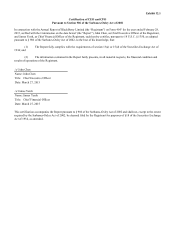
Selected Quarterly Financial Data
The following table sets forth the Company’s unaudited quarterly consolidated results of operations data for each of the eight
most recent quarters, including the quarter ended February 28, 2015. The information in the table below has been derived from
the Company’s unaudited interim consolidated financial statements that, in management’s opinion, have been prepared on a
basis consistent with the audited consolidated financial statements of the Company and include all adjustments necessary for a
fair presentation of information when read in conjunction with the audited consolidated financial statements of the Company.
The Company’s quarterly operating results have varied substantially in the past and may vary substantially in the future.
Accordingly, the information below is not necessarily indicative of results for any future quarter.
(in millions, except per share data)
Fiscal Year 2015 Fiscal Year 2014
Fourth
Quarter Third
Quarter Second
Quarter First
Quarter Fourth
Quarter Third
Quarter Second
Quarter First
Quarter
Revenue $ 660 $ 793 $ 916 $ 966 $ 976 $ 1,193 $ 1,573 $ 3,071
Gross margin 318 410 425 451 553 (1,264)(374) 1,042
Operating expenses 424 549 623 431 1,090 3,761 1,058 1,211
Loss before income taxes (1) (160) (218)(6)(557)(5,025)(1,438)(164)
Provision for (recovery of)
income taxes (29) (12) (11)(29)(134)(624)(473)(80)
Net income (loss) $ 28 $ (148) $ (207) $ 23 $ (423) $ (4,401) $ (965) $ (84)
Earnings (loss) per share
Basic and diluted earnings
(loss) per share $ 0.05 $ (0.28) $ (0.39) $ 0.04 $ (0.80) $ (8.37) $ (1.84) $ (0.16)
Research and development $ 134 $ 154 $ 186 $ 237 $ 246 $ 322 $ 360 $ 358
Selling, marketing and
administration 172 171 195 400 355 548 527 673
Amortization 68 74 75 81 107 148 171 180
Impairment of long-lived
assets — — — — — 2,748 — —
Debentures fair value
adjustment 50 150 167 (287) 382 (5) — —
Operating expenses $ 424 $ 549 $ 623 $ 431 $ 1,090 $ 3,761 $ 1,058 $ 1,211
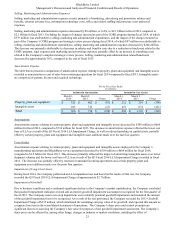
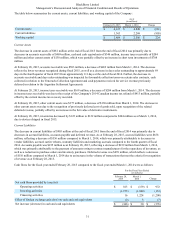
Financial Condition
Liquidity and Capital Resources
Cash, cash equivalents, and investments increased by $608 million to $3.3 billion as at February 28, 2015 from $2.7 billion as
at March 1, 2014, primarily as a result of the receipt of the Company's fiscal 2014 Canadian income tax refund, the Rockstar
Sale, the RSU Trust Share Sale, and proceeds from the Real Estate Sale, which were partially offset by net changes in working
capital and cash used in investing activities. The majority of the Company’s cash, cash equivalents, and investments are
denominated in U.S. dollars as at February 28, 2015.
A comparative summary of cash, cash equivalents, and investments is set out below:
As at
(in millions)
February 28, 2015 March 1, 2014 Change
Cash and cash equivalents $ 1,233 $ 1,579 $ (346)
Restricted cash 59 — 59
Short-term investments 1,658 950 708
Long-term investments 316 129 187
Cash, cash equivalents, and investments $ 3,266 $ 2,658 $ 608