Blackberry 2015 Annual Report Download - page 119
Download and view the complete annual report
Please find page 119 of the 2015 Blackberry annual report below. You can navigate through the pages in the report by either clicking on the pages listed below, or by using the keyword search tool below to find specific information within the annual report.-
 1
1 -
2
-
3
-
4
-
5
-
6
-
7
-
8
-
9
-
10
-
11
-
12
-
13
-
14
-
15
-
16
-
17
-
18
-
19
-
20
-
21
-
22
-
23
-
24
-
25
-
26
-
27
-
28
-
29
-
30
-
31
-
32
-
33
-
34
-
35
-
36
-
37
-
38
-
39
-
40
-
41
-
42
-
43
-
44
-
45
-
46
-
47
-
48
-
49
-
50
-
51
-
52
-
53
-
54
-
55
-
56
-
57
-
58
-
59
-
60
-
61
-
62
-
63
-
64
-
65
-
66
-
67
-
68
-
69
-
70
-
71
-
72
-
73
-
74
-
75
-
76
-
77
-
78
-
79
-
80
-
81
-
82
-
83
-
84
-
85
-
86
-
87
-
88
-
89
-
90
-
91
-
92
-
93
-
94
-
95
-
96
-
97
-
98
-
99
-
100
-
101
-
102
-
103
-
104
-
105
-
106
-
107
-
108
-
 109
109 -
 110
110 -
 111
111 -
 112
112 -
 113
113 -
 114
114 -
 115
115 -
 116
116 -
 117
117 -
 118
118 -
 119
119 -
 120
120 -
 121
121 -
 122
122 -
 123
123 -
 124
124 -
 125
125 -
 126
126 -
 127
127 -
 128
128 -
 129
129 -
130
-
131
-
132
-
133
-
134
-
135
-
136
-
137
-
138
-
139
-
140
-
141
-
142
-
143
-
144
-
145
-
146
-
147
-
148
-
149
-
150
-
151
-
152
-
153
-
154
-
155
-
156
-
157
-
158
-
159
-
160
-
161
-
162
-
163
-
164
-
165
-
166
-
167
-
168
-
169
-
170
-
171
-
172
-
173
-
174
-
175
-
176
-
177
-
178
-
179
-
180
-
181
-
182
-
183
-
184
-
185
-
186
-
187
-
188
-
189
-
190
-
191
-
192
-
193
-
194
-
195
-
196
-
197
-
198
-
199
-
200
-
201
-
202
-
203
-
204
-
205
-
206
-
207
-
208
-
209
-
210
-
211
-
212
-
213
-
214
-
215
-
216
-
217
-
218
 |
 |

BlackBerry Limited
Management’s Discussion and Analysis of Financial Condition and Results of Operations
8
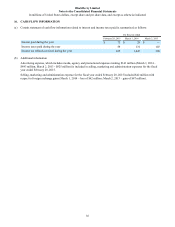
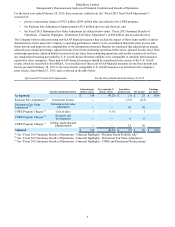
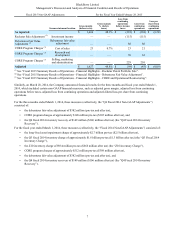
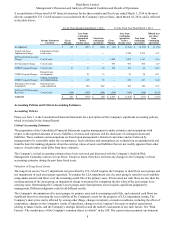
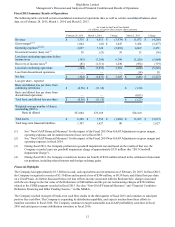
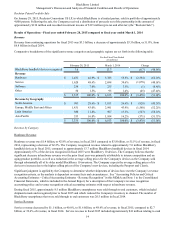
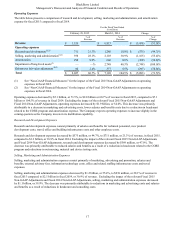
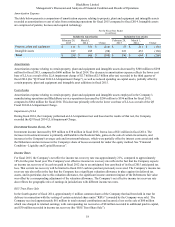
A reconciliation of these non-GAAP financial measures for the three months and fiscal year ended March 1, 2014 to the most
directly comparable U.S. GAAP measures was included in the Company’s press release, dated March 28, 2014, and is reflected
in the table below:
For the Three Months Ended March 1, 2014 For the Fiscal Year Ended March 1, 2014
Income Statement
Location Gross
Margin
Loss from
continuing
operations
before
income taxes
Loss from
continuing
operations Gross
Margin
Loss from
continuing
operations
before
income taxes
Loss from
continuing
operations
Diluted loss
per share
from
continuing
operations
As reported $ 553 $ (557) $ (423) $ (43) $ (7,184) $ (5,873) $ (11.18)
Long-lived Asset
Impairment Charge Impairment of long-
lived assets — — —— 2,748 2,475 4.71
Q3 Fiscal 2014 Inventory
Charge Cost of sales — — — 1,592 1,592 1,347 2.56
Z10 Inventory Charge Cost of sales — — —934 934 666 1.27
CORE Program Charges Cost of sales 17 17 12 103 103 83 0.16
CORE Program Charges Research and
development — 21 15 — 76 58 0.11
CORE Program Charges Selling, marketing
and administration — 110 78 — 333 257 0.49
Debentures Fair Value
Adjustment Debentures fair
value adjustment — 382 382 — 382 382 0.73
Q4 Fiscal 2014 Inventory
Recovery Cost of sales (149) (149) (106) (149) (149) (106) (0.20)
Adjusted $ 421 $ (176) $ (42) $ 2,437 $ (1,165) $ (711) $ (1.35)
Accounting Policies and Critical Accounting Estimates
Accounting Policies
Please see Note 1 to the Consolidated Financial Statements for a description of the Company's significant accounting policies,
which is included in the Annual Report.
Critical Accounting Estimates
The preparation of the Consolidated Financial Statements requires management to make estimates and assumptions with
respect to the reported amounts of assets, liabilities, revenues and expenses and the disclosure of contingent assets and
liabilities. These estimates and assumptions are based upon management’s historical experience and are believed by
management to be reasonable under the circumstances. Such estimates and assumptions are evaluated on an ongoing basis and
form the basis for making judgments about the carrying values of assets and liabilities that are not readily apparent from other
sources. Actual results could differ from these estimates.
The Company’s critical accounting estimates have been reviewed and discussed with the Company’s Audit & Risk
Management Committee and are set out below. Except as noted, there have not been any changes to the Company’s critical
accounting estimates during the past three fiscal years.
Valuation of Long-Lived Assets
The long-lived assets (“LLA”) impairment test prescribed by U.S. GAAP requires the Company to identify its asset groups and
test impairment of each asset group separately. To conduct the LLA impairment test, the asset group is tested for recoverability
using undiscounted cash flows over the remaining useful life of the primary asset. If forecasted net cash flows are less than the
carrying amount of the asset group, an impairment charge is measured by comparing the fair value of the asset group to its
carrying value. Determining the Company's asset groups and related primary assets requires significant judgment by
management. Different judgments could yield different results.
The Company's determination of its asset groups, its primary asset and its remaining useful life, and estimated cash flows are
significant factors in assessing the recoverability of the Company's assets for the purposes of LLA impairment testing. The
Company's share price can be affected by, among other things, changes in industry or market conditions, including the effect of
competition, changes in the Company's results of operations, changes in the Company's forecasts or market expectations
relating to future results, and the Company's strategic initiatives and the market's assessment of any such factors. See “Risk
Factors - The market price of the Company's common shares is volatile” in the AIF. The current macroeconomic environment