Blackberry 2015 Annual Report Download - page 126
Download and view the complete annual report
Please find page 126 of the 2015 Blackberry annual report below. You can navigate through the pages in the report by either clicking on the pages listed below, or by using the keyword search tool below to find specific information within the annual report.-
 1
1 -
2
-
3
-
4
-
5
-
6
-
7
-
8
-
9
-
10
-
11
-
12
-
13
-
14
-
15
-
16
-
17
-
18
-
19
-
20
-
21
-
22
-
23
-
24
-
25
-
26
-
27
-
28
-
29
-
30
-
31
-
32
-
33
-
34
-
35
-
36
-
37
-
38
-
39
-
40
-
41
-
42
-
43
-
44
-
45
-
46
-
47
-
48
-
49
-
50
-
51
-
52
-
53
-
54
-
55
-
56
-
57
-
58
-
59
-
60
-
61
-
62
-
63
-
64
-
65
-
66
-
67
-
68
-
69
-
70
-
71
-
72
-
73
-
74
-
75
-
76
-
77
-
78
-
79
-
80
-
81
-
82
-
83
-
84
-
85
-
86
-
87
-
88
-
89
-
90
-
91
-
92
-
93
-
94
-
95
-
96
-
97
-
98
-
99
-
100
-
101
-
102
-
103
-
104
-
105
-
106
-
107
-
108
-
109
-
110
-
111
-
112
-
113
-
114
-
115
-
 116
116 -
 117
117 -
 118
118 -
 119
119 -
 120
120 -
 121
121 -
 122
122 -
 123
123 -
 124
124 -
 125
125 -
 126
126 -
 127
127 -
 128
128 -
 129
129 -
 130
130 -
 131
131 -
 132
132 -
 133
133 -
 134
134 -
 135
135 -
 136
136 -
137
-
138
-
139
-
140
-
141
-
142
-
143
-
144
-
145
-
146
-
147
-
148
-
149
-
150
-
151
-
152
-
153
-
154
-
155
-
156
-
157
-
158
-
159
-
160
-
161
-
162
-
163
-
164
-
165
-
166
-
167
-
168
-
169
-
170
-
171
-
172
-
173
-
174
-
175
-
176
-
177
-
178
-
179
-
180
-
181
-
182
-
183
-
184
-
185
-
186
-
187
-
188
-
189
-
190
-
191
-
192
-
193
-
194
-
195
-
196
-
197
-
198
-
199
-
200
-
201
-
202
-
203
-
204
-
205
-
206
-
207
-
208
-
209
-
210
-
211
-
212
-
213
-
214
-
215
-
216
-
217
-
218
 |
 |

BlackBerry Limited
Management’s Discussion and Analysis of Financial Condition and Results of Operations
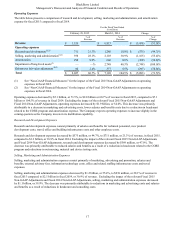
15
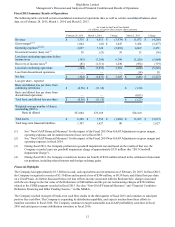
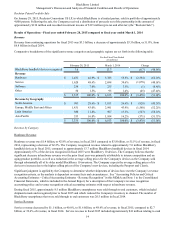
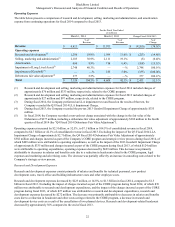
payments of previously deferred service revenue as part of the Venezuela Collection Agreement, as well as $40 million from
carrier partners in Argentina for service revenue previously deferred. The decrease is primarily attributable to a lower number
of BlackBerry users and lower revenue from those users as compared to fiscal 2014. The year-over-year decrease also resulted
from a continued shift in the mix of the Company’s customers from higher-tiered unlimited plans to prepaid and lower-tiered
plans as well as pricing reduction programs implemented by the Company to maintain the customer base. The Company
expects service revenue to decline by approximately 15% per quarter in fiscal 2016.
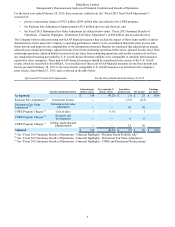
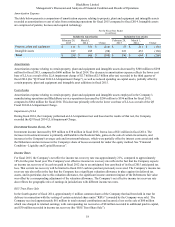
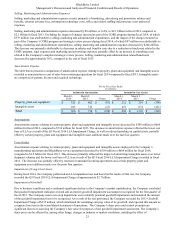
Software Revenue
Software revenue, which includes fees from licensed BES software, client access licenses, technical support, maintenance and
upgrades and QNX software licensing revenues, decreased by $1 million, or 0.4%, to $234 million, or 7.0% of revenue, in
fiscal 2015, compared to $235 million, or 3.5% of revenue, in fiscal 2014. The decrease was primarily attributable to a decrease
in technical support, which was offset by an increase in QNX revenue and client access license fees.
The Company continues to target $600 million in software revenue in fiscal 2016, including revenue generated from BBM
services such as BBM Protected and BBM Meetings. The Company is focusing on enterprise in developed markets and
consumers in developing markets to generate BBM revenue, and expects to generate other software revenue from monetizing
existing and forthcoming products, including as described above in “Business Overview - Strategic Initiatives and Products and
Services Update”. The Company expects the rate of growth of software revenue to accelerate in the second half of fiscal 2016.
The Company expects the generation of revenue from software and services and its other technologies to mitigate the impact of
declining service access fees.
Other Revenue
Other revenue, which includes non-warranty repairs, accessories, licensing revenues and gains and losses on qualifying revenue
cash flow hedges, decreased by $45 million, or 47.4% to $50 million, or 1.5% in fiscal 2015 compared to $95 million, or 1.4%
in fiscal 2014. The decrease was primarily attributable to a decrease in accessory and non-warranty repair revenues.
Revenue Trends
The Company has seen both its revenue and its smartphone market share decline in recent years relative to companies such as
Apple with its iOS ecosystem, and companies that build smartphones based on the Android ecosystem, such as Samsung and
Lenovo/Motorola.
This decline is due to a variety of factors, including consumer preferences for devices with access to the broadest number of
applications, such as those available in the iOS and Android platforms, and lower average selling prices for the Company's
devices. Revenue and market share have also been impacted by intense competition, including from the significant number of
new Android based competitors that have emerged, and by the BYOD trend in the enterprise market. Some of the Company’s
competitors have greater name recognition, larger customer bases, and significantly greater financial, technical, marketing,
public relations, sales, distribution and other resources than the Company. In addition, uncertainty relating to the Company's
strategy and operations may have negatively impacted demand for the Company's products.
The Company has introduced both software and hardware products to address the shift in the market toward enterprise mobility
solutions that can handle a range of requirements and deployment models. The products include BlackBerry 10 smartphones
with BlackBerry Balance and the BES12 platform, which unifies the support for BBOS and BlackBerry 10 devices, together
with that for iOS, Android and Windows Phone® devices. This gives IT departments the ability to securely monitor and control
multiple OS platforms and securely protect corporate data on an employee’s personal smartphone or tablet.
For further information regarding the Company’s competitors, please see the section in the AIF entitled “Narrative Description
of the Business - Competition”.
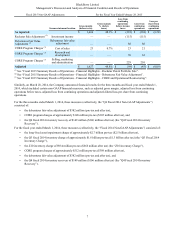
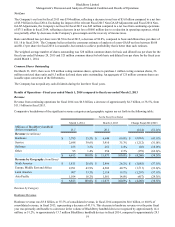
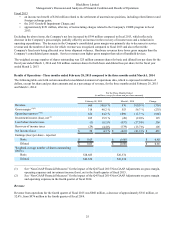
Revenue by Geography
North America Revenues
Revenues in North America were $991 million or 29.6% of revenue in fiscal 2015, reflecting a decrease of $820 million
compared to $1.8 billion, or 26.6% of revenue in fiscal 2014. The decrease in North American revenue is primarily attributable
to a decrease in revenue from the United States, which represented approximately 23.2% of total revenue in fiscal 2015,
compared to 19.4% of total revenue in fiscal 2014. Sales in Canada represented approximately 6.4% of total revenue in fiscal
2015, compared to 7.2% of total revenue in fiscal 2014.
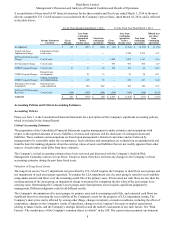
Revenues in North America have continued to decline due to the Company's aging product portfolio, consumer preferences for
devices with access to the broadest number of applications, such as those available in the iOS and Android environments,