Blackberry 2015 Annual Report Download - page 142
Download and view the complete annual report
Please find page 142 of the 2015 Blackberry annual report below. You can navigate through the pages in the report by either clicking on the pages listed below, or by using the keyword search tool below to find specific information within the annual report.-
 1
1 -
2
-
3
-
4
-
5
-
6
-
7
-
8
-
9
-
10
-
11
-
12
-
13
-
14
-
15
-
16
-
17
-
18
-
19
-
20
-
21
-
22
-
23
-
24
-
25
-
26
-
27
-
28
-
29
-
30
-
31
-
32
-
33
-
34
-
35
-
36
-
37
-
38
-
39
-
40
-
41
-
42
-
43
-
44
-
45
-
46
-
47
-
48
-
49
-
50
-
51
-
52
-
53
-
54
-
55
-
56
-
57
-
58
-
59
-
60
-
61
-
62
-
63
-
64
-
65
-
66
-
67
-
68
-
69
-
70
-
71
-
72
-
73
-
74
-
75
-
76
-
77
-
78
-
79
-
80
-
81
-
82
-
83
-
84
-
85
-
86
-
87
-
88
-
89
-
90
-
91
-
92
-
93
-
94
-
95
-
96
-
97
-
98
-
99
-
100
-
101
-
102
-
103
-
104
-
105
-
106
-
107
-
108
-
109
-
110
-
111
-
112
-
113
-
114
-
115
-
116
-
117
-
118
-
119
-
120
-
121
-
122
-
123
-
124
-
125
-
126
-
127
-
128
-
129
-
130
-
131
-
 132
132 -
 133
133 -
 134
134 -
 135
135 -
 136
136 -
 137
137 -
 138
138 -
 139
139 -
 140
140 -
 141
141 -
 142
142 -
 143
143 -
 144
144 -
 145
145 -
 146
146 -
 147
147 -
 148
148 -
 149
149 -
 150
150 -
 151
151 -
 152
152 -
153
-
154
-
155
-
156
-
157
-
158
-
159
-
160
-
161
-
162
-
163
-
164
-
165
-
166
-
167
-
168
-
169
-
170
-
171
-
172
-
173
-
174
-
175
-
176
-
177
-
178
-
179
-
180
-
181
-
182
-
183
-
184
-
185
-
186
-
187
-
188
-
189
-
190
-
191
-
192
-
193
-
194
-
195
-
196
-
197
-
198
-
199
-
200
-
201
-
202
-
203
-
204
-
205
-
206
-
207
-
208
-
209
-
210
-
211
-
212
-
213
-
214
-
215
-
216
-
217
-
218
 |
 |

BlackBerry Limited
Management’s Discussion and Analysis of Financial Condition and Results of Operations
31
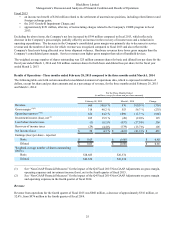
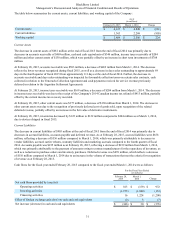
The table below summarizes the current assets, current liabilities, and working capital of the Company:
As at
(in millions)
February 28, 2015 March 1, 2014 Change
Current assets $ 4,167 $ 4,848 $ (681)
Current liabilities 1,363 2,268 (905)
Working capital $ 2,804 $ 2,580 $ 224
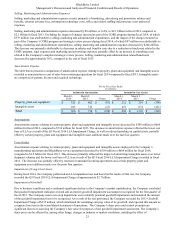
Current Assets
The decrease in current assets of $681 million at the end of fiscal 2015 from the end of fiscal 2014 was primarily due to
decreases in accounts receivable of $469 million, cash and cash equivalents of $346 million, income taxes receivable of $204
million and other current assets of $130 million, which were partially offset by an increase in short term investments of $708
million.
At February 28, 2015, accounts receivable was $503 million, a decrease of $469 million from March 1, 2014. The decrease
reflects the lower revenues recognized during fiscal 2015, as well as a decrease in days sales outstanding to approximately 69
days in the fourth quarter of fiscal 2015 from approximately 111 days at the end of fiscal 2014. Further, the decrease in
accounts receivable and days sales outstanding was impacted by favourable collection terms on certain sales contracts, cash
collected in relation to the Venezuela Collection Agreement and cash payments received for service revenue previously
deferred in relation to the Argentina Settlement Agreements.
At February 28, 2015, income taxes receivable was $169 million, a decrease of $204 million from March 1, 2014. The decrease
in income taxes receivable was due to the receipt of the Company's 2014 Canadian income tax refund of $413 million, partially
offset by the current income tax recovery recorded.
At February 28, 2015, other current assets was $375 million, a decrease of $130 million from March 1, 2014. The decrease in
other current assets was due to the recognition of previously deferred cost of goods sold, upon recognition of the related
deferred revenue, partially offset by an increase in the fair value of derivative instruments.
At February 28, 2015, inventories decreased by $122 million to $122 million compared to $244 million as at March 1, 2014,
due to devices shipped in fiscal 2015.
Current Liabilities
The decrease in current liabilities of $905 million at the end of fiscal 2015 from the end of fiscal 2014 was primarily due to
decreases in accrued liabilities, accounts payable and deferred revenue. As at February 28, 2015, accrued liabilities were $658
million, reflecting a decrease of $556 million compared to March 1, 2014, which was primarily attributable to decreases in
vendor liabilities, accrued carrier rebates, warranty liabilities and marketing accruals compared to the fourth quarter of fiscal
2014. Accounts payable was $235 million as at February 28, 2015, reflecting a decrease of $239 million from March 1, 2014,
which was primarily attributable to the payment of amounts owing to contract manufacturers for the repurchase of inventory, as
well as a reduction in purchase orders and inventory purchases. Deferred revenue was $470 million, which reflects a decrease
of $110 million compared to March 1, 2014 due to an increase in the volume of transactions that met the criteria for recognition
of revenue as at February 28, 2015.
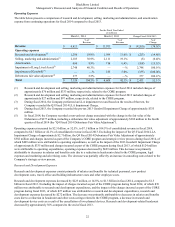
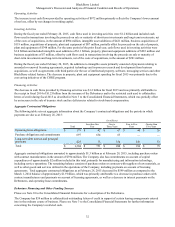
Cash flows for the fiscal year ended February 28, 2015 compared to the fiscal year ended March 1, 2014 were as follows:
For the Fiscal Year Ended
(in millions)
February 28,
2015 March 1,
2014 Change
Net cash flows provided by (used in):
Operating activities $ 813 $ (159) $ 972
Investing activities (1,173)(1,040)(133)
Financing activities 16 1,224 (1,208)
Effect of foreign exchange gain (loss) on cash and cash equivalents (2) 5 (7)
Net increase (decrease) in cash and cash equivalents $(346) $ 30 $ (376)