Blackberry 2015 Annual Report Download - page 117
Download and view the complete annual report
Please find page 117 of the 2015 Blackberry annual report below. You can navigate through the pages in the report by either clicking on the pages listed below, or by using the keyword search tool below to find specific information within the annual report.-
 1
1 -
2
-
3
-
4
-
5
-
6
-
7
-
8
-
9
-
10
-
11
-
12
-
13
-
14
-
15
-
16
-
17
-
18
-
19
-
20
-
21
-
22
-
23
-
24
-
25
-
26
-
27
-
28
-
29
-
30
-
31
-
32
-
33
-
34
-
35
-
36
-
37
-
38
-
39
-
40
-
41
-
42
-
43
-
44
-
45
-
46
-
47
-
48
-
49
-
50
-
51
-
52
-
53
-
54
-
55
-
56
-
57
-
58
-
59
-
60
-
61
-
62
-
63
-
64
-
65
-
66
-
67
-
68
-
69
-
70
-
71
-
72
-
73
-
74
-
75
-
76
-
77
-
78
-
79
-
80
-
81
-
82
-
83
-
84
-
85
-
86
-
87
-
88
-
89
-
90
-
91
-
92
-
93
-
94
-
95
-
96
-
97
-
98
-
99
-
100
-
101
-
102
-
103
-
104
-
105
-
106
-
 107
107 -
 108
108 -
 109
109 -
 110
110 -
 111
111 -
 112
112 -
 113
113 -
 114
114 -
 115
115 -
 116
116 -
 117
117 -
 118
118 -
 119
119 -
 120
120 -
 121
121 -
 122
122 -
 123
123 -
 124
124 -
 125
125 -
 126
126 -
 127
127 -
128
-
129
-
130
-
131
-
132
-
133
-
134
-
135
-
136
-
137
-
138
-
139
-
140
-
141
-
142
-
143
-
144
-
145
-
146
-
147
-
148
-
149
-
150
-
151
-
152
-
153
-
154
-
155
-
156
-
157
-
158
-
159
-
160
-
161
-
162
-
163
-
164
-
165
-
166
-
167
-
168
-
169
-
170
-
171
-
172
-
173
-
174
-
175
-
176
-
177
-
178
-
179
-
180
-
181
-
182
-
183
-
184
-
185
-
186
-
187
-
188
-
189
-
190
-
191
-
192
-
193
-
194
-
195
-
196
-
197
-
198
-
199
-
200
-
201
-
202
-
203
-
204
-
205
-
206
-
207
-
208
-
209
-
210
-
211
-
212
-
213
-
214
-
215
-
216
-
217
-
218
 |
 |

BlackBerry Limited
Management’s Discussion and Analysis of Financial Condition and Results of Operations
6
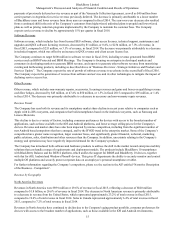
For the fiscal year ended February 28, 2015, these measures (collectively, the “Fiscal 2015 Non-GAAP Adjustments”)
consisted of:
• pre-tax restructuring charges of $322 million ($294 million after tax) related to the CORE program,
• the Rockstar Sale Adjustment of approximately $115 million (pre-tax and after-tax), and
• the Fiscal 2015 Debentures Fair Value Adjustment (as defined below under “Fiscal 2015 Summary Results of
Operations - Financial Highlights - Debentures Fair Value Adjustment”) of $80 million (pre-tax and after tax).
The Company believes that presenting non-GAAP financial measures that exclude the impact of those items enables it and its
shareholders to better assess the Company’s operating performance relative to its consolidated financial results in prior and
future periods and improves the comparability of the information presented. Readers are cautioned that adjusted gross margin,
adjusted gross margin percentage, adjusted income (loss) from continuing operations before taxes, adjusted income (loss) from
continuing operations, adjusted diluted income (loss) per share from continuing operations and similar measures do not have
any standardized meaning prescribed by U.S. GAAP and are therefore unlikely to be comparable to similarly titled measures
reported by other companies. These non-GAAP financial measures should be considered in the context of the U.S. GAAP
results, which are described in this MD&A. A reconciliation of these non-GAAP financial measures for the three months and
fiscal year ended February 28, 2015 to the most directly comparable U.S. GAAP measures was included in the Company’s
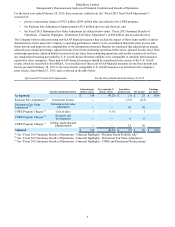
press release, dated March 27, 2015, and is reflected in the table below.
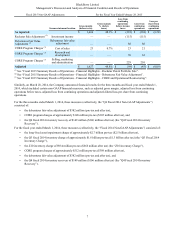
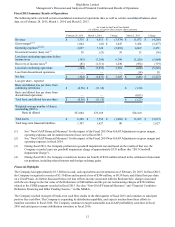
Q4 Fiscal 2015 Non-GAAP Adjustments For the Three Months Ended February 28, 2015
Income statement location Gross margin
(before taxes) Gross margin %
(before taxes) Loss before
income taxes Net income Earnings
per share
As reported $ 318 48.2% $ (1) $ 28 $ 0.05
Rockstar Sale Adjustment (1) Investment income — — (115)(115)
Debentures Fair Value
Adjustment (2) Debentures fair value
adjustment — — 50 50
CORE Program Charges (3) Cost of sales 1 0.1% 1 1
CORE Program Charges (3) Research and
development — — 6 6
CORE Program Charges (3) Selling, marketing and
administration — — 51 50
Adjusted $ 319 48.3% $ (8) $ 20 $ 0.04
(1) See “Fiscal 2015 Summary Results of Operations - Financial Highlights - Rockstar Patent Portfolio Sale”.
(2) See “Fiscal 2015 Summary Results of Operations - Financial Highlights - Debentures Fair Value Adjustment”.
(3) See “Fiscal 2015 Summary Results of Operations - Financial Highlights - CORE and Operational Restructuring”.