Blackberry 2015 Annual Report Download - page 127
Download and view the complete annual report
Please find page 127 of the 2015 Blackberry annual report below. You can navigate through the pages in the report by either clicking on the pages listed below, or by using the keyword search tool below to find specific information within the annual report.-
 1
1 -
2
-
3
-
4
-
5
-
6
-
7
-
8
-
9
-
10
-
11
-
12
-
13
-
14
-
15
-
16
-
17
-
18
-
19
-
20
-
21
-
22
-
23
-
24
-
25
-
26
-
27
-
28
-
29
-
30
-
31
-
32
-
33
-
34
-
35
-
36
-
37
-
38
-
39
-
40
-
41
-
42
-
43
-
44
-
45
-
46
-
47
-
48
-
49
-
50
-
51
-
52
-
53
-
54
-
55
-
56
-
57
-
58
-
59
-
60
-
61
-
62
-
63
-
64
-
65
-
66
-
67
-
68
-
69
-
70
-
71
-
72
-
73
-
74
-
75
-
76
-
77
-
78
-
79
-
80
-
81
-
82
-
83
-
84
-
85
-
86
-
87
-
88
-
89
-
90
-
91
-
92
-
93
-
94
-
95
-
96
-
97
-
98
-
99
-
100
-
101
-
102
-
103
-
104
-
105
-
106
-
107
-
108
-
109
-
110
-
111
-
112
-
113
-
114
-
115
-
116
-
 117
117 -
 118
118 -
 119
119 -
 120
120 -
 121
121 -
 122
122 -
 123
123 -
 124
124 -
 125
125 -
 126
126 -
 127
127 -
 128
128 -
 129
129 -
 130
130 -
 131
131 -
 132
132 -
 133
133 -
 134
134 -
 135
135 -
 136
136 -
 137
137 -
138
-
139
-
140
-
141
-
142
-
143
-
144
-
145
-
146
-
147
-
148
-
149
-
150
-
151
-
152
-
153
-
154
-
155
-
156
-
157
-
158
-
159
-
160
-
161
-
162
-
163
-
164
-
165
-
166
-
167
-
168
-
169
-
170
-
171
-
172
-
173
-
174
-
175
-
176
-
177
-
178
-
179
-
180
-
181
-
182
-
183
-
184
-
185
-
186
-
187
-
188
-
189
-
190
-
191
-
192
-
193
-
194
-
195
-
196
-
197
-
198
-
199
-
200
-
201
-
202
-
203
-
204
-
205
-
206
-
207
-
208
-
209
-
210
-
211
-
212
-
213
-
214
-
215
-
216
-
217
-
218
 |
 |

BlackBerry Limited
Management’s Discussion and Analysis of Financial Condition and Results of Operations
16
intense competition and a reduction in service revenue. Sales in North America have also been impacted by the significant
number of new Android based competitors that have entered the market.
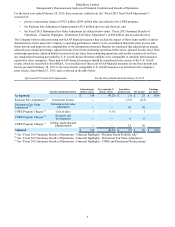
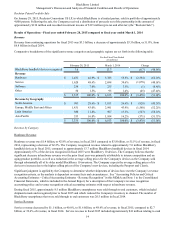
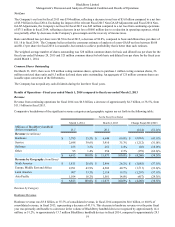
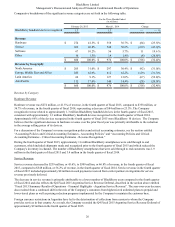
Europe, Middle East and Africa Revenues
Revenues in Europe, Middle East and Africa were $1.4 billion or 43.0% of revenue in fiscal 2015, reflecting a decrease of $1.6
billion compared to $3.0 billion or 43.9% of revenue in fiscal 2014. The Company believes that the decrease in revenues is due
to the same factors discussed above related to the decrease in North America revenues.
The Company's largest markets in this region include the United Kingdom, South Africa and Germany.
Latin America Revenues
Revenues in Latin America were $380 million or 11.4% of revenue in fiscal 2015, reflecting a decrease of $527 million
compared to $907 million or 13.3% of revenue in fiscal 2014. The Company believes that the decrease in revenues is due to the
same factors discussed above related to the decrease in North America revenues. The decrease is also attributable to the
Argentina currency restrictions discussed in the section entitled “Fiscal 2015 Summary Results of Operations - Financial
Highlights - Argentina Service Revenue”.
The Company's largest markets in this region include Argentina, Mexico and Venezuela.
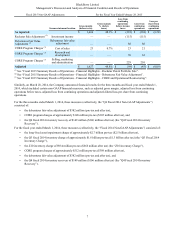
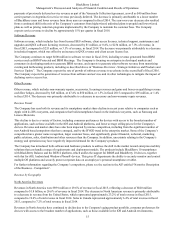
Asia Pacific Revenues
Revenues in Asia Pacific were $533 million or 16.0% of revenue in fiscal 2015, reflecting a decrease of $571 million compared
to $1.1 billion or 16.2% of revenue in fiscal 2014. The Company believes that the decrease in revenues is due to the same
factors discussed above related to the decrease in North America revenues.
The Company's largest markets in this region include Indonesia, India and Hong Kong.
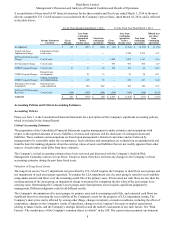
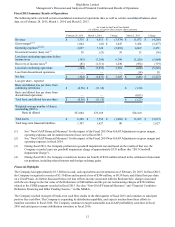
Gross Margin
Gross margin increased by $1.6 billion or 3,830.2%, to $1.6 billion, or 48.1% of revenue, in fiscal 2015, compared to $(43)
million, or (0.6)% of revenue, in fiscal 2014. Excluding the relevant Fiscal 2015 Non-GAAP Adjustments and Fiscal 2014
Non-GAAP Adjustments explained in “Non-GAAP Financial Measures” above, gross margin decreased by $810 million to
$1.6 billion, or 48.8% of revenue.
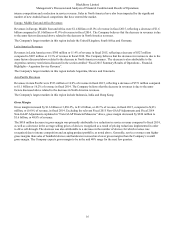
The $810 million decrease in gross margin was primarily attributable to a reduction in service revenue compared to fiscal 2014,
as well as a decrease in the average selling prices of devices recognized as a result of pricing reductions implemented in order
to drive sell-through. The decrease was also attributable to a decrease in the number of devices for which revenue was
recognized due to intense competition and an aging product portfolio, as noted above. Generally, service revenues earn higher
gross margins than sales of handheld devices and hardware revenues have lower gross margins than the Company’s overall
gross margin. The Company expects gross margin to be in the mid 40% range for the next few quarters.