Blackberry 2015 Annual Report Download - page 118
Download and view the complete annual report
Please find page 118 of the 2015 Blackberry annual report below. You can navigate through the pages in the report by either clicking on the pages listed below, or by using the keyword search tool below to find specific information within the annual report.-
 1
1 -
2
-
3
-
4
-
5
-
6
-
7
-
8
-
9
-
10
-
11
-
12
-
13
-
14
-
15
-
16
-
17
-
18
-
19
-
20
-
21
-
22
-
23
-
24
-
25
-
26
-
27
-
28
-
29
-
30
-
31
-
32
-
33
-
34
-
35
-
36
-
37
-
38
-
39
-
40
-
41
-
42
-
43
-
44
-
45
-
46
-
47
-
48
-
49
-
50
-
51
-
52
-
53
-
54
-
55
-
56
-
57
-
58
-
59
-
60
-
61
-
62
-
63
-
64
-
65
-
66
-
67
-
68
-
69
-
70
-
71
-
72
-
73
-
74
-
75
-
76
-
77
-
78
-
79
-
80
-
81
-
82
-
83
-
84
-
85
-
86
-
87
-
88
-
89
-
90
-
91
-
92
-
93
-
94
-
95
-
96
-
97
-
98
-
99
-
100
-
101
-
102
-
103
-
104
-
105
-
106
-
107
-
 108
108 -
 109
109 -
 110
110 -
 111
111 -
 112
112 -
 113
113 -
 114
114 -
 115
115 -
 116
116 -
 117
117 -
 118
118 -
 119
119 -
 120
120 -
 121
121 -
 122
122 -
 123
123 -
 124
124 -
 125
125 -
 126
126 -
 127
127 -
 128
128 -
129
-
130
-
131
-
132
-
133
-
134
-
135
-
136
-
137
-
138
-
139
-
140
-
141
-
142
-
143
-
144
-
145
-
146
-
147
-
148
-
149
-
150
-
151
-
152
-
153
-
154
-
155
-
156
-
157
-
158
-
159
-
160
-
161
-
162
-
163
-
164
-
165
-
166
-
167
-
168
-
169
-
170
-
171
-
172
-
173
-
174
-
175
-
176
-
177
-
178
-
179
-
180
-
181
-
182
-
183
-
184
-
185
-
186
-
187
-
188
-
189
-
190
-
191
-
192
-
193
-
194
-
195
-
196
-
197
-
198
-
199
-
200
-
201
-
202
-
203
-
204
-
205
-
206
-
207
-
208
-
209
-
210
-
211
-
212
-
213
-
214
-
215
-
216
-
217
-
218
 |
 |
BlackBerry Limited
Management’s Discussion and Analysis of Financial Condition and Results of Operations
7
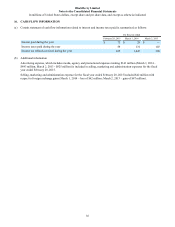
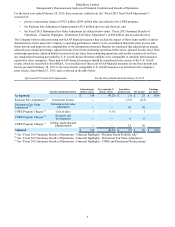
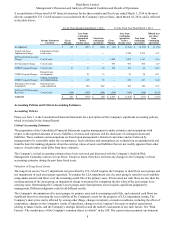
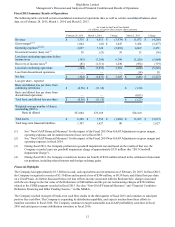
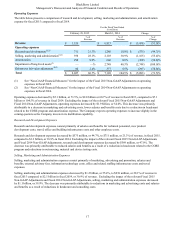
Fiscal 2015 Non-GAAP Adjustments For the Fiscal Year Ended February 28, 2015
Income statement location Gross margin
(before taxes)
Gross margin
% (before
taxes)
Loss from
continuing
operations
before income
taxes
Loss from
continuing
operations
Loss per
share from
continuing
operations
As reported $ 1,604 48.1% $ (385) $ (304) $ (0.58)
Rockstar Sale Adjustment (1) Investment income — — (115)(115)
Debentures Fair Value
Adjustment (2) Debentures fair value
adjustment — — 80 80
CORE Program Charges (3) Cost of sales 23 0.7% 23 21
CORE Program Charges (3) Research and
development — — 70 63
CORE Program Charges (3) Selling, marketing
and administration — — 229 210
Adjusted $ 1,627 48.8% $ (98) $ (45) $ (0.09)
(1) See “Fiscal 2015 Summary Results of Operations - Financial Highlights - Rockstar Patent Portfolio Sale”.
(2) See “Fiscal 2015 Summary Results of Operations - Financial Highlights - Debentures Fair Value Adjustment”.
(3) See “Fiscal 2015 Summary Results of Operations - Financial Highlights - CORE and Operational Restructuring”.
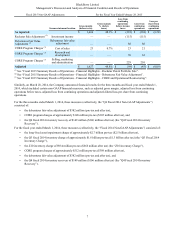
Similarly, on March 28, 2014, the Company announced financial results for the three months and fiscal year ended March 1,
2014, which included certain non-GAAP financial measures, such as adjusted gross margin, adjusted loss from continuing
operations before taxes, adjusted loss from continuing operations and adjusted diluted loss per share from continuing
operations.
For the three months ended March 1, 2014, these measures (collectively, the “Q4 Fiscal 2014 Non-GAAP Adjustments”)
consisted of:
• the debentures fair value adjustment of $382 million (pre-tax and after tax),
• CORE program charges of approximately $148 million pre-tax ($105 million after tax), and
• the Q4 fiscal 2014 inventory recovery of $149 million ($106 million after tax) (the “Q4 Fiscal 2014 Inventory
Recovery”).
For the fiscal year ended March 1, 2014, these measures (collectively, the “Fiscal 2014 Non-GAAP Adjustments”) consisted of:
• the long-lived asset impairment charge of approximately $2.7 billion pre-tax ($2.5 billion after tax),
• the Q3 fiscal 2014 inventory charge of approximately $1.6 billion pre-tax ($1.3 billion after tax) (the “Q3 Fiscal 2014
Inventory Charge”),
• the Z10 inventory charge of $934 million pre-tax ($666 million after tax) (the “Z10 Inventory Charge”),
• CORE program charges of approximately $512 million pre-tax ($398 million after tax),
• the debentures fair value adjustment of $382 million (pre-tax and after tax), and
• the Q4 fiscal 2014 inventory recovery of $149 million ($106 million after tax) (the “Q4 Fiscal 2014 Inventory
Recovery”).