Vodafone 2010 Annual Report Download - page 97
Download and view the complete annual report
Please find page 97 of the 2010 Vodafone annual report below. You can navigate through the pages in the report by either clicking on the pages listed below, or by using the keyword search tool below to find specific information within the annual report.-
 1
1 -
2
-
3
-
4
-
5
-
6
-
7
-
8
-
9
-
10
-
11
-
12
-
13
-
14
-
15
-
16
-
17
-
18
-
19
-
20
-
21
-
22
-
23
-
24
-
25
-
26
-
27
-
28
-
29
-
30
-
31
-
32
-
33
-
34
-
35
-
36
-
37
-
38
-
39
-
40
-
41
-
42
-
43
-
44
-
45
-
46
-
47
-
48
-
49
-
50
-
51
-
52
-
53
-
54
-
55
-
56
-
57
-
58
-
59
-
60
-
61
-
62
-
63
-
64
-
65
-
66
-
67
-
68
-
69
-
70
-
71
-
72
-
73
-
74
-
75
-
76
-
77
-
78
-
79
-
80
-
81
-
82
-
83
-
84
-
85
-
86
-
 87
87 -
 88
88 -
 89
89 -
 90
90 -
 91
91 -
 92
92 -
 93
93 -
 94
94 -
 95
95 -
 96
96 -
 97
97 -
 98
98 -
 99
99 -
 100
100 -
 101
101 -
 102
102 -
 103
103 -
 104
104 -
 105
105 -
 106
106 -
 107
107 -
108
-
109
-
110
-
111
-
112
-
113
-
114
-
115
-
116
-
117
-
118
-
119
-
120
-
121
-
122
-
123
-
124
-
125
-
126
-
127
-
128
-
129
-
130
-
131
-
132
-
133
-
134
-
135
-
136
-
137
-
138
-
139
-
140
-
141
-
142
-
143
-
144
-
145
-
146
-
147
-
148
 |
 |
Financials
Vodafone Group Plc Annual Report 2010 95
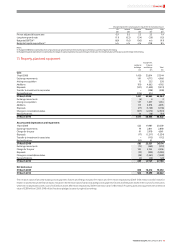
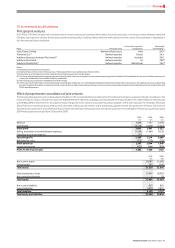
Change required for carrying value to equal the recoverable amount
UK Ireland Romania Germany Italy
pps pps pps pps pps
Pre-tax adjusted discount rate 0.9 0.2 2.2 3.3 1.4
Long-term growth rate (1.1) (0.3) (3.4) (3.9) (1.5)
Budgeted EBITDA(1) (6.9) (1.6) (9.0) n/a (9.1)
Budgeted capital expenditure(2) n/a n/a n/a 23.8 8.5
Notes:
(1) Budgeted EBITDA is expressed as the compound annual growth rates in the initial five years of the plans used for impairment testing.
(2) Budgeted capital expenditure is expressed as the range of capital expenditure as a percentage of revenue in the initial five years of the plans used for impairment testing.
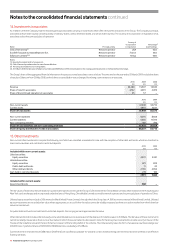
11. Property, plant and equipment
Equipment,
Land and fixtures
buildings and fittings Total
£m £m £m
Cost:
1 April 2008 1,430 35,814 37,244
Exchange movements 191 4,775 4,966
Arising on acquisition 15 223 238
Additions 100 4,665 4,765
Disposals (101) (1,450) (1,551)
Transfer to investment in associates –(298) (298)
Reclassifications (214) 214 –
31 March 2009 1,421 43,943 45,364
Exchange movements (6) 8 2
Arising on acquisition 157 1,457 1,614
Additions 115 4,878 4,993
Disposals (27) (1,109) (1,136)
Change in consolidation status (107) (2,274) (2,381)
Reclassifications 24 (58) (34)
31 March 2010 1,577 46,845 48,422
Accumulated depreciation and impairment:
1 April 2008 522 19,987 20,509
Exchange movements 79 2,811 2,890
Charge for the year 91 3,970 4,061
Disposals (17) (1,217) (1,234)
Transfer to investment in associates –(112) (112)
Reclassifications (92) 92 –
31 March 2009 583 25,531 26,114
Exchange movements (12) (260) (272)
Charge for the year 102 4,354 4,456
Disposals (10) (995) (1,005)
Change in consolidation status (28) (1,461) (1,489)
Reclassifications (2) (22) (24)
31 March 2010 633 27,147 27,780
Net book value:
31 March 2009 838 18,412 19,250
31 March 2010 944 19,698 20,642
The net book value of land and buildings and equipment, fixtures and fittings includes £91 million and £111 million respectively (2009: £106 million and £82 million) in
relation to assets held under finance leases. Included in the net book value of land and buildings and equipment, fixtures and fittings are assets in the course of construction,
which are not depreciated, with a cost of £45 million and £1,496 million respectively (2009: £44 million and £1,186 million). Property, plant and equipment with a net book
value of £389 million (2009: £148 million) has been pledged as security against borrowings.