Vodafone 2010 Annual Report Download - page 108
Download and view the complete annual report
Please find page 108 of the 2010 Vodafone annual report below. You can navigate through the pages in the report by either clicking on the pages listed below, or by using the keyword search tool below to find specific information within the annual report.-
 1
1 -
2
-
3
-
4
-
5
-
6
-
7
-
8
-
9
-
10
-
11
-
12
-
13
-
14
-
15
-
16
-
17
-
18
-
19
-
20
-
21
-
22
-
23
-
24
-
25
-
26
-
27
-
28
-
29
-
30
-
31
-
32
-
33
-
34
-
35
-
36
-
37
-
38
-
39
-
40
-
41
-
42
-
43
-
44
-
45
-
46
-
47
-
48
-
49
-
50
-
51
-
52
-
53
-
54
-
55
-
56
-
57
-
58
-
59
-
60
-
61
-
62
-
63
-
64
-
65
-
66
-
67
-
68
-
69
-
70
-
71
-
72
-
73
-
74
-
75
-
76
-
77
-
78
-
79
-
80
-
81
-
82
-
83
-
84
-
85
-
86
-
87
-
88
-
89
-
90
-
91
-
92
-
93
-
94
-
95
-
96
-
97
-
 98
98 -
 99
99 -
 100
100 -
 101
101 -
 102
102 -
 103
103 -
 104
104 -
 105
105 -
 106
106 -
 107
107 -
 108
108 -
 109
109 -
 110
110 -
 111
111 -
 112
112 -
 113
113 -
 114
114 -
 115
115 -
 116
116 -
 117
117 -
 118
118 -
119
-
120
-
121
-
122
-
123
-
124
-
125
-
126
-
127
-
128
-
129
-
130
-
131
-
132
-
133
-
134
-
135
-
136
-
137
-
138
-
139
-
140
-
141
-
142
-
143
-
144
-
145
-
146
-
147
-
148
 |
 |

106 Vodafone Group Plc Annual Report 2010
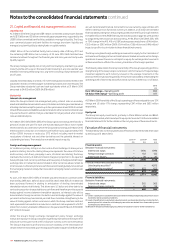
Notes to the consolidated nancial statements continued
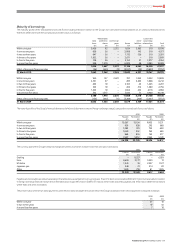
22. Borrowings continued
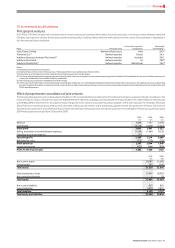
The fair value and carrying value of the Group’s long-term borrowings is as follows:
Sterling equivalent
nominal value Fair value Carrying value
2010 2009 2010 2009 2010 2009
£m £m £m £m £m £m
Financial liabilities measured at amortised cost:
Bank loans 4,149 4,993 4,183 5,159 4,183 5,159
Redeemable preference shares 1,174 1,237 1,098 1,453 1,242 1,453
Other liabilities 385 4,314 385 4,186 385 4 ,122
Bonds: 11,455 6,976 11,961 6,559 12,675 8,064
US dollar floating rate note due June 2011 230 245 230 227 230 245
5.5% US dollar 750 million bond due June 2011 494 – 518 – 524 –
Euro floating rate note due January 2012 1,158 1,203 1,157 1,136 1,161 1,218
US dollar floating rate note due February 2012 329 350 329 322 329 350
5.35% US dollar 500 million bond due February 2012 329 – 351 – 352 –
3.625% euro 1,250 million bond due November 2012 1,113 – 1,157 – 1,149 –
6.75% Australian dollar 265 million bond due January 2013 160 – 161 – 167 –
Czech krona floating rate note due June 2013 19 18 19 18 19 18
Euro floating rate note due September 2013 757 786 756 714 758 788
5.0% US dollar 1,000 million bond due December 2013 658 – 704 – 718 –
6.875% euro 1,000 million bond due December 2013 891 – 1,024 – 936 –
Euro floating rate note due June 2014 1,113 1,157 1,099 1,029 1,114 1,158
4.15% US dollar 1,250 million bond due June 2014 823 – 856 – 852 –
5.125% euro 500 million bond due April 2015 445 463 496 470 475 495
3.375% US dollar 500 million bond due November 2015 329 – 327 – 330 –
5% euro 750 million bond due June 2018 668 694 721 699 694 721
7.875% US dollar 750 million bond due February 2030 494 525 589 577 814 876
6.25% US dollar 495 million bond due November 2032 326 346 328 333 453 485
6.15% US dollar 1,700 million bond due February 2037 1,119 1,189 1,139 1,034 1,600 1,710
Bonds in fair value hedge relationships: 9,395 11,823 10,085 11,982 10,147 12,951
5.875% euro 1,250 million bond due June 2010 – 1,157 – 1,195 – 1,258
5.5% US dollar 750 million bond due June 2011 – 525 – 544 – 575
5.35% US dollar 500 million bond due February 2012 – 350 – 357 – 385
3.625% euro 1,000 million bond due November 2012 – 925 – 919 – 967
6.75% Australian dollar 265 million bond due January 2013 –128 – 127 – 140
5.0% US dollar 1,000 million bond due December 2013 – 699 – 713 – 786
6.875% euro 1,000 million bond due December 2013 – 925 – 1,005 – 973
4.625% sterling 350 million bond due September 2014 350 350 367 352 388 381
4.625% sterling 525 million bond due September 2014 525 525 550 526 532 519
2.15% Japanese yen 3,000 million bond due April 2015 21 21 22 22 22 22
5.375% US dollar 900 million bond due January 2015 592 630 636 632 650 711
5.0% US dollar 750 million bond due September 2015 494 525 529 516 543 598
6.25% euro 1,250 million bond due January 2016 1,113 1,157 1,278 1,208 1,168 1,182
5.75% US dollar 750 million bond due March 2016 494 525 536 527 556 614
4.75% euro 500 million bond due June 2016 445 463 477 448 503 512
5.625% US dollar 1,300 million bond due February 2017 856 909 919 904 960 1,070
5.375% sterling 600 million bond due December 2017 600 – 634 – 628 –
4.625% US dollar 500 million bond due July 2018 329 350 328 315 349 392
8.125% sterling 450 million bond due November 2018 450 450 553 535 487 483
5.45% US dollar 1,250 million bond due June 2019 823 – 857 – 849 –
4.65% euro 1,250 million bond January 2022 1,113 –1,129 –1,145 –
5.375% euro 500 million bond June 2022 445 463 481 433 525 534
5.625% sterling 250 million bond due December 2025 250 250 254 234 285 287
6.6324% euro 50 million bond due December 2028 45 46 64 46 54 50
5.9% sterling 450 million bond due November 2032 450 450 471 424 503 512
Long-term borrowings 26,558 29,343 27,712 29,339 28,632 31,749
During the year ended 31 March 2010 fair value hedge relationships relating to bonds with nominal value US$2,750 million (£1,810 million), €4,750 million (£4,125 million)
and AUD 265 million (£161 million) were de-designated.
Fair values are calculated using quoted market prices or discounted cash flows with a discount rate based upon forward interest rates available to the Group at the end of
reporting period date.