Vodafone 2010 Annual Report Download - page 138
Download and view the complete annual report
Please find page 138 of the 2010 Vodafone annual report below. You can navigate through the pages in the report by either clicking on the pages listed below, or by using the keyword search tool below to find specific information within the annual report.-
 1
1 -
2
-
3
-
4
-
5
-
6
-
7
-
8
-
9
-
10
-
11
-
12
-
13
-
14
-
15
-
16
-
17
-
18
-
19
-
20
-
21
-
22
-
23
-
24
-
25
-
26
-
27
-
28
-
29
-
30
-
31
-
32
-
33
-
34
-
35
-
36
-
37
-
38
-
39
-
40
-
41
-
42
-
43
-
44
-
45
-
46
-
47
-
48
-
49
-
50
-
51
-
52
-
53
-
54
-
55
-
56
-
57
-
58
-
59
-
60
-
61
-
62
-
63
-
64
-
65
-
66
-
67
-
68
-
69
-
70
-
71
-
72
-
73
-
74
-
75
-
76
-
77
-
78
-
79
-
80
-
81
-
82
-
83
-
84
-
85
-
86
-
87
-
88
-
89
-
90
-
91
-
92
-
93
-
94
-
95
-
96
-
97
-
98
-
99
-
100
-
101
-
102
-
103
-
104
-
105
-
106
-
107
-
108
-
109
-
110
-
111
-
112
-
113
-
114
-
115
-
116
-
117
-
118
-
119
-
120
-
121
-
122
-
123
-
124
-
125
-
126
-
127
-
 128
128 -
 129
129 -
 130
130 -
 131
131 -
 132
132 -
 133
133 -
 134
134 -
 135
135 -
 136
136 -
 137
137 -
 138
138 -
 139
139 -
 140
140 -
 141
141 -
 142
142 -
 143
143 -
 144
144 -
 145
145 -
 146
146 -
 147
147 -
 148
148
 |
 |

136 Vodafone Group Plc Annual Report 2010
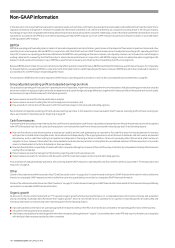
In the discussion of our reported financial position, operating results and cash flows, information is presented to provide readers with additional financial information that is
regularly reviewed by management. However this additional information presented is not uniformly defined by all companies including those in the Group’s industry.
Accordingly, it may not be comparable with similarly titled measures and disclosures by other companies. Additionally, certain information presented is derived from amounts
calculated in accordance with IFRS but is not itself an expressly permitted GAAP measure. Such non-GAAP measures should not be viewed in isolation or as an alternative
to the equivalent GAAP measure.
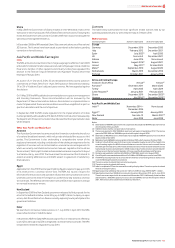
EBITDA
EBITDA is operating profit excluding share in results of associates, depreciation and amortisation, gains/losses on the disposal of fixed assets, impairment losses and other
operating income and expense. We use EBITDA, in conjunction with other GAAP and non-GAAP financial measures such as adjusted operating profit, operating profit and
net profit, to assess our operating performance. We believe that EBITDA is an operating performance measure, not a liquidity measure, as it includes non-cash changes in
working capital and is reviewed by the Chief Executive to assess internal performance in conjunction with EBITDA margin, which is an alternative sales margin figure. We
believe it is both useful and necessary to report EBITDA as a performance measure as it enhances the comparability of profit across segments.
Because EBITDA does not take into account certain items that affect operations and performance, EBITDA has inherent limitations as a performance measure. To compensate
for these limitations, we analyse EBITDA in conjunction with other GAAP and non-GAAP operating performance measures. EBITDA should not be considered in isolation or
as a substitute for a GAAP measure of operating performance.
A reconciliation of EBITDA to the closest equivalent GAAP measure, operating profit, is provided in note 3 to the consolidated financial statements on page 85.
Group adjusted operating prot and adjusted earnings per share
Group adjusted operating profit excludes non-operating income of associates, impairment losses and other income and expense. Adjusted earnings per share also excludes
amounts in relation to equity put rights and similar arrangements and certain foreign exchange differences, together with related tax effects. We believe that it is both useful
and necessary to report these measures for the following reasons:
these measures are used for internal performance analysis;
these measures are used in setting director and management remuneration; and
they are useful in connection with discussion with the investment analyst community and debt rating agencies.
Reconciliations of adjusted operating profit and adjusted earnings per share to the respective closest equivalent GAAP measure, operating profit and basic earnings per
share, are provided in “Operating results” beginning on page 25.
Cash ow measures
In presenting and discussing our reported results, free cash flow and operating free cash flow are calculated and presented even though these measures are not recognised
within IFRS. We believe that it is both useful and necessary to communicate free cash flow to investors and other interested parties, for the following reasons:
free cash flow allows us and external parties to evaluate our liquidity and the cash generated by our operations. Free cash flow does not include payments for licences
and spectrum included within intangible assets, items determined independently of the ongoing business, such as the level of dividends, and items which are deemed
discretionary, such as cash flows relating to acquisitions and disposals or financing activities. In addition, it does not necessarily reflect the amounts which we have an
obligation to incur. However it does reflect the cash available for such discretionary activities, to strengthen the consolidated statement of financial position or to provide
returns to shareholders in the form of dividends or share purchases;
free cash flow facilitates comparability of results with other companies although our measure of free cash flow may not be directly comparable to similarly titled measures
used by other companies;
these measures are used by management for planning, reporting and incentive purposes; and
these measures are useful in connection with discussion with the investment analyst community and debt rating agencies.
A reconciliation of cash generated by operations, the closest equivalent GAAP measure, to operating free cash flow and free cash flow, is provided in “Financial position and
resources” on page 41.
Other
Certain of the statements within the section titled “Chief Executive’s review” on pages 6 to 9 contain forward-looking non-GAAP financial information for which at this time
there is no comparable GAAP measure and which at this time cannot be quantitatively reconciled to comparable GAAP financial information.
Certain of the statements within the section titled “Guidance” on page 37 contain forward-looking non-GAAP financial information which at this time cannot be quantitatively
reconciled to comparable GAAP financial information.
Organic growth
All amounts in this document marked with an “(*)” represent organic growth which present performance on a comparable basis, both in terms of merger and acquisition
activity and foreign exchange rates. We believe that “organic growth”, which is not intended to be a substitute for or superior to reported growth, provides useful and
necessary information to investors and other interested parties for the following reasons:
it provides additional information on underlying growth of the business without the effect of certain factors unrelated to the operating performance of the business;
it is used for internal performance analysis; and
it facilitates comparability of underlying growth with other companies, although the term “organic” is not a defined term under IFRS and may not, therefore, be comparable
with similarly titled measures reported by other companies.
Non-GAAP information