Vodafone 2010 Annual Report Download - page 6
Download and view the complete annual report
Please find page 6 of the 2010 Vodafone annual report below. You can navigate through the pages in the report by either clicking on the pages listed below, or by using the keyword search tool below to find specific information within the annual report.-
 1
1 -
 2
2 -
 3
3 -
 4
4 -
 5
5 -
 6
6 -
 7
7 -
 8
8 -
 9
9 -
 10
10 -
 11
11 -
 12
12 -
 13
13 -
 14
14 -
 15
15 -
 16
16 -
 17
17 -
18
-
19
-
20
-
21
-
22
-
23
-
24
-
25
-
26
-
27
-
28
-
29
-
30
-
31
-
32
-
33
-
34
-
35
-
36
-
37
-
38
-
39
-
40
-
41
-
42
-
43
-
44
-
45
-
46
-
47
-
48
-
49
-
50
-
51
-
52
-
53
-
54
-
55
-
56
-
57
-
58
-
59
-
60
-
61
-
62
-
63
-
64
-
65
-
66
-
67
-
68
-
69
-
70
-
71
-
72
-
73
-
74
-
75
-
76
-
77
-
78
-
79
-
80
-
81
-
82
-
83
-
84
-
85
-
86
-
87
-
88
-
89
-
90
-
91
-
92
-
93
-
94
-
95
-
96
-
97
-
98
-
99
-
100
-
101
-
102
-
103
-
104
-
105
-
106
-
107
-
108
-
109
-
110
-
111
-
112
-
113
-
114
-
115
-
116
-
117
-
118
-
119
-
120
-
121
-
122
-
123
-
124
-
125
-
126
-
127
-
128
-
129
-
130
-
131
-
132
-
133
-
134
-
135
-
136
-
137
-
138
-
139
-
140
-
141
-
142
-
143
-
144
-
145
-
146
-
147
-
148
 |
 |

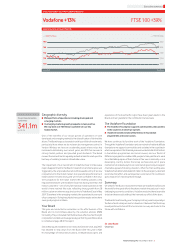
Price
Minutes
2008
(16.8) (12.5) (21.8)
24.0
12.4
22.7
2009 2010
130 120
93
45 54
69
48
Eastern
Europe
Western
Europe USA/
Canada
Other
Asia
Pacific
Africa
India China
Other Asia Pacific
Africa
Other
China
India
USA/Canada
Eastern Europe
Western Europe
519
480
309
525
725
866
464
764
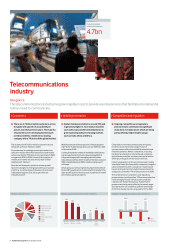
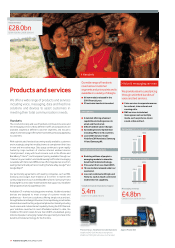
4 Vodafone Group Plc Annual Report 2010
Telecommunications
industry
There are 4.7 billion mobile customers across
the globe with growth of around 20% per
annum over the last three years. The majority
of customers are in emerging markets such
as India and China. Vodafone is a leading
company with a 7% share of the global market.
Global mobile penetration is around 70% and
is generally higher in more mature markets
such as Europe and the United States but is
growing most quickly in emerging markets
such as India, China and Africa.
Ongoing competitive and regulatory
pressures have contributed to significant
reductions in mobile prices which are being
partly offset by higher mobile usage.
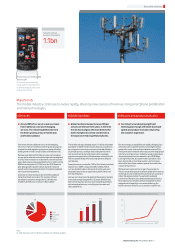
At a glance
The telecommunications industry has grown rapidly in size to provide essential services that facilitate a fundamental
human need to communicate.
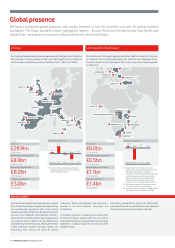
Mobile customers (m) Vodafone outgoing voice prices and minutes (%)Mobile penetration at December 2009 (%)
Customers Mobile penetration Competition and regulation
Industry global
mobile customers
4.7bn
The industry has 4.7 billion mobile customers across
the globe, up from 2.7 billion in 2006.
Consumers are increasingly choosing to make voice
calls over mobile rather than fixed phones and mobile
calls accounted for 70% of all phone calls made in 2009
compared to 50% in 2006. As a result the number of
mobile users now far exceeds the number of fixed
telephones (1.3 billion).
Over the last three years mobile customer growth
has been strongest in emerging markets such as India
and China. In contrast growth has been more muted
in developed regions such as Europe which are
relatively mature..
Mobile penetration (the proportion of the population
that have a mobile) has grown to around 70% from 40%
in December 2006.
Looking forward the number of worldwide mobile phone
users is expected to continue to grow strongly. Most of
this growth is expected in emerging markets such as
India, China and Africa where mobile penetration is around
50% compared to about 130% in mature markets such
as Europe.
Developing countries are generally expected to deliver
faster GDP growth which combined with relatively little
alternative fixed line infrastructure is positive for mobile
penetration growth prospects.
Competition in the telecommunications industry
is intense. Consumers have a large choice of
communication offers from established mobile and
fixed line operators. Newer competitors, including
handset manufacturers, internet based companies
and software providers, are also entering the market
offering converged communication services.
Industry regulators continue to impose lower mobile
termination rates (the fees mobile companies charge for
calls received from other companies’ networks) and
lower roaming prices. Termination fees and roaming
charges accounted for 17% of Group revenue in 2010.
The combination of competition and regulatory
pressures have contributed to a 17% per annum decline
in the average price per minute across our global
network over the last three years. However price
pressures are being partly offset by increased usage.
During the year our customers spoke for an average
of 191 minutes per month compared to 137 in 2007.