Vodafone 2010 Annual Report Download - page 33
Download and view the complete annual report
Please find page 33 of the 2010 Vodafone annual report below. You can navigate through the pages in the report by either clicking on the pages listed below, or by using the keyword search tool below to find specific information within the annual report.-
 1
1 -
2
-
3
-
4
-
5
-
6
-
7
-
8
-
9
-
10
-
11
-
12
-
13
-
14
-
15
-
16
-
17
-
18
-
19
-
20
-
21
-
22
-
 23
23 -
 24
24 -
 25
25 -
 26
26 -
 27
27 -
 28
28 -
 29
29 -
 30
30 -
 31
31 -
 32
32 -
 33
33 -
 34
34 -
 35
35 -
 36
36 -
 37
37 -
 38
38 -
 39
39 -
 40
40 -
 41
41 -
 42
42 -
 43
43 -
44
-
45
-
46
-
47
-
48
-
49
-
50
-
51
-
52
-
53
-
54
-
55
-
56
-
57
-
58
-
59
-
60
-
61
-
62
-
63
-
64
-
65
-
66
-
67
-
68
-
69
-
70
-
71
-
72
-
73
-
74
-
75
-
76
-
77
-
78
-
79
-
80
-
81
-
82
-
83
-
84
-
85
-
86
-
87
-
88
-
89
-
90
-
91
-
92
-
93
-
94
-
95
-
96
-
97
-
98
-
99
-
100
-
101
-
102
-
103
-
104
-
105
-
106
-
107
-
108
-
109
-
110
-
111
-
112
-
113
-
114
-
115
-
116
-
117
-
118
-
119
-
120
-
121
-
122
-
123
-
124
-
125
-
126
-
127
-
128
-
129
-
130
-
131
-
132
-
133
-
134
-
135
-
136
-
137
-
138
-
139
-
140
-
141
-
142
-
143
-
144
-
145
-
146
-
147
-
148
 |
 |

Performance
Vodafone Group Plc Annual Report 2010 31
Revenue
Revenue increased by 15.6%, with favourable exchange rates contributing
13.0 percentage points and the impact of merger and acquisition activity contributing
3.0 percentage points to revenue growth. Pro-forma revenue growth, including the
acquisition in India and the acquisition of Tele2 in Italy and Spain, was 1%.
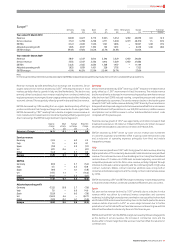
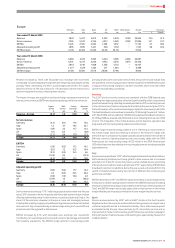
Revenue in Europe declined by 2.1%(*) as benefits from new tariffs and promotions
and a strong performance in data revenue were more than offset by the impact of
the deteriorating European economy on voice and messaging revenue, including
from roaming, usage growth, ongoing competitive pricing pressures and lower
termination rates.
In Africa and Central Europe, revenue grew by 3.9%(*) with double-digit revenue
growth in Vodacom being offset by weakening trends in Turkey and Romania.
Benefits from the increase in the average customer base were partially offset by both
weaker economic conditions in the more mature markets in Central Europe and the
impact of termination rate cuts.
In Asia Pacific and Middle East, revenue grew by 19% on a pro-forma basis including
India, a result of the rise in the average customer base, although revenue growth
slowed primarily as a result of stronger competition coupled with maturing
market conditions.
Operating profit
EBITDA increased by 10.0% to £14,490 million, with favourable exchange rates
contributing 13.4 percentage points and the impact of merger and acquisition
activity contributing 0.1 percentage points to EBITDA growth. Including India and
Tele2 in Italy and Spain, pro-forma EBITDA declined by 3%.
In Europe EBITDA decreased by 5.0%(*), with a decline in the EBITDA margin, primarily
driven by the downward revenue trend, the growth of lower margin fixed line
operations, a brand royalty provision release included in the 2008 financial year in
Italy and restructuring charges in a number of markets, which more than offset
customer and operating cost savings. The European EBITDA margin, including
Common Functions which substantially support our European operations, declined
by 1.2 percentage points driven by an increasing contribution from lower margin
fixed broadband.
Africa and Central Europe’s EBITDA decreased by 2.3%(*), with the EBITDA margin
decreasing in the majority of markets due to continued network expansion,
investment in the turnaround plan in Turkey and increased competition in Romania.
In Asia Pacific and Middle East EBITDA increased by 7% on a pro-forma basis including
India, with a decline in the EBITDA margin as licensing costs increased and network
expansion continued, primarily in India, but also through the build out in Qatar.
The increase in Common Functions’ EBITDA in the 2009 financial year resulted
primarily from the inclusion of a brand royalty payment charge in the 2008 financial
year and increased brand revenue in the 2009 financial year following agreement of
revised terms with Vodafone Italy.
Operating profit decreased due to the growth in adjusted operating profit being more
than offset by impairment losses in relation to operations in Spain (£3,400 million),
Turkey (£2,250 million) and Ghana (£250 million). Adverse changes in macroeconomic
assumptions generated the £550 million charge recorded in the second half of the
2009 financial year in relation to Turkey and all of the charge in relation to Ghana.
Adjusted operating profit increased by 16.7%, or 2.0%(*), with a 16.5 percentage point
contribution from favourable exchange rates, whilst the impact of merger and
acquisition activity reduced adjusted operating profit growth by 1.8 percentage points.
The share of results in Verizon Wireless, our associate in the US, increased by 21.6%(*)
primarily due to a focus on the high value contract segment and low customer churn.
On 9 January 2009 Verizon Wireless completed its acquisition of Alltel Corp. (‘Alltel’),
adding 13.2 million customers before required divestitures.
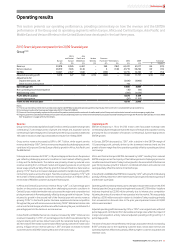
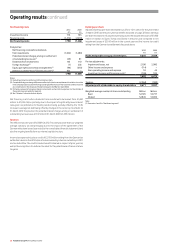
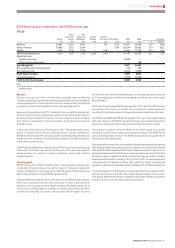
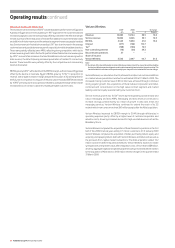
2009 nancial year compared to the 2008 nancial year
Group
Africa Asia
and Central Pacific and Verizon Common
Europe Europe Middle East Wireless Functions(1) Eliminations 2009 2008 % change
£m £m £m £m £m £m £m £m £Organic
Revenue 29,634 5,501 5,819 −216 (153) 41,017 35,478 15.6 (0.4)
Service revenue 27,886 5,113 5,434 − − (139) 38,294 33,042 15.9 (0.3)
EBITDA 11,149 1,720 1,779 −(158) −14,490 13,178 10.0 (3.5)
Adjusted operating profit 7,125 675 556 3,542 (141) −11,757 10,075 16.7 2.0
Adjustments for:
Impairment losses (5,900) −
Other income and expense −(28)
Operating profit 5,857 10,047
Non-operating income and expense (44) 254
Net financing costs (1,624) (1,300)
Profit before taxation 4,189 9,001
Income tax expense (1,109) (2,245)
Profit for the financial year 3,080 6,756
Note:
(1) Common Functions represents the results of the partner markets and the net result of unallocated central Group costs and recharges to our operations, including royalty fees for use of the
Vodafone brand.