Vodafone 2010 Annual Report Download - page 107
Download and view the complete annual report
Please find page 107 of the 2010 Vodafone annual report below. You can navigate through the pages in the report by either clicking on the pages listed below, or by using the keyword search tool below to find specific information within the annual report.-
 1
1 -
2
-
3
-
4
-
5
-
6
-
7
-
8
-
9
-
10
-
11
-
12
-
13
-
14
-
15
-
16
-
17
-
18
-
19
-
20
-
21
-
22
-
23
-
24
-
25
-
26
-
27
-
28
-
29
-
30
-
31
-
32
-
33
-
34
-
35
-
36
-
37
-
38
-
39
-
40
-
41
-
42
-
43
-
44
-
45
-
46
-
47
-
48
-
49
-
50
-
51
-
52
-
53
-
54
-
55
-
56
-
57
-
58
-
59
-
60
-
61
-
62
-
63
-
64
-
65
-
66
-
67
-
68
-
69
-
70
-
71
-
72
-
73
-
74
-
75
-
76
-
77
-
78
-
79
-
80
-
81
-
82
-
83
-
84
-
85
-
86
-
87
-
88
-
89
-
90
-
91
-
92
-
93
-
94
-
95
-
96
-
 97
97 -
 98
98 -
 99
99 -
 100
100 -
 101
101 -
 102
102 -
 103
103 -
 104
104 -
 105
105 -
 106
106 -
 107
107 -
 108
108 -
 109
109 -
 110
110 -
 111
111 -
 112
112 -
 113
113 -
 114
114 -
 115
115 -
 116
116 -
 117
117 -
118
-
119
-
120
-
121
-
122
-
123
-
124
-
125
-
126
-
127
-
128
-
129
-
130
-
131
-
132
-
133
-
134
-
135
-
136
-
137
-
138
-
139
-
140
-
141
-
142
-
143
-
144
-
145
-
146
-
147
-
148
 |
 |

Financials
Vodafone Group Plc Annual Report 2010 105
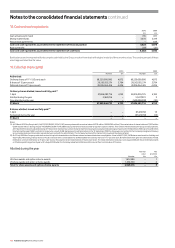
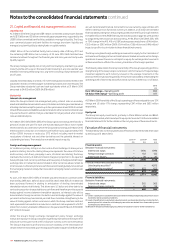
22. Borrowings
Carrying value and fair value information
2010 2009
Short-term Long-term Short-term Long-term
borrowings borrowings Total borrowings borrowings Total
£m £m £m £m £m £m
Financial liabilities measured at amortised cost:
Bank loans 3,460 4,183 7,643 893 5,159 6,052
Bank overdrafts 60 – 60 32 −32
Redeemable preference shares – 1,242 1,242 – 1,453 1,453
Commercial paper 2,563 –2,563 2,659 −2,659
Bonds 1,174 12,675 13,849 515 8,064 8,579
Other liabilities(1)(2) 3,906 385 4,291 1,015 4,122 5,137
Bonds in fair value hedge relationships – 10,147 10,147 4,510 12,951 17,461
11,163 28,632 39,795 9,624 31,749 41,373
Notes:
(1) At 31 March 2010 amount includes £604 million (2009: £691 million) in relation to collateral support agreements.
(2) Amounts at 31 March 2010 includes £3,405 million (2009: £3,606 mi ll ion) in relation to the written pu t options disclosed in note 12 and written p ut options granted to the Essar Group th at , if exercised,
would allow the Essar Group to sell its 33% shareholding in Vodafone Essar to the Group for US$5 billion or to sell up to US$5 billion worth of Vodafone Essar shares at an independently appraised fair
market value.
Banks loans include a ZAR 4.85 billion loan borrowed by Vodafone Holdings SA Pty Limited (‘VHSA’), which directly and indirectly owns the Group’s 65% interest in Vodacom
Group Limited. VHSA has pledged its 100% equity shareholding in Vodafone Investments SA (‘VISA’), which holds a direct 20.1% equity shareholding in Vodacom Group
Limited, as security for its loan obligations. The terms and conditions of the pledge mean that should VHSA not meet all of its loan payment and performance obligations,
the lenders may sell the equity shareholding in its subsidiary VISA at market value to recover their losses, with any remaining sales proceeds being returned to VHSA.
Vodafone International Holdings B.V. has also guaranteed this loan with recourse only to the VHSA shares it has pledged. The terms and conditions of the security arrangement
mean the lenders may be able to sell these respective shares in preference to the VISA shares held by VHSA. An arrangement has been put in place where the Vodacom
Group Limited shares held by VHSA and VISA are held in an escrow account to ensure the shares cannot be sold to satisfy the pledge made by the Company. The maximum
collateral provided is ZAR 4.85 billion, being the carrying value of the bank loan at 31 March 2010 (2009: ZAR 6.4 billion). Bank loans also include INR175 billion of loans held
by Vodafone Essar Limited (‘VEL’) and its subsidiaries (the ‘VEL Group’). The VEL Group has a number of security arrangements supporting certain licences secured under
the terms of tri-party agreements between the relevant borrower, the department of telecommunications, Government of India and the agent representing the secured
lenders and certain share pledges of the shares under VEL. The terms and conditions of the security arrangements mean that should members of the VEL Group not meet
all of their loan payment and performance obligations, the lenders may sell the pledged shares and enforce rights over the certain licences under the terms of the tri-party
agreements to recover their losses, with any remaining sales proceeds being returned to the VEL Group. Each of the eight legal entities within the VEL Group provide cross
guarantees to the lenders in respect to debt contracted by the other seven.
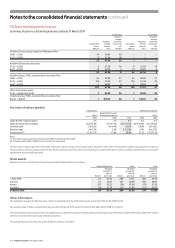
The fair value and carrying value of the Group’s short-term borrowings is as follows:
Sterling equivalent
nominal value Fair value Carrying value
2010 2009 2010 2009 2010 2009
£m £m £m £m £m £m
Financial liabilities measured at amortised cost 11,023 5,131 11,130 5 ,108 11,163 5 ,114
Bonds in fair value hedge relationships: – 4,320 – 4,397 – 4,510
4.25% euro 1,859 million bond due May 2009 – 1,720 – 1,722 – 1,780
4.75% euro 859 million bond due May 2009 – 794 – 798 – 831
7.75% US dollar 2,582 million bond due February 2010 –1,806 –1,877 –1,899
Short-term borrowings 11,023 9,451 11,130 9,505 11,163 9,624