Vodafone 2010 Annual Report Download - page 139
Download and view the complete annual report
Please find page 139 of the 2010 Vodafone annual report below. You can navigate through the pages in the report by either clicking on the pages listed below, or by using the keyword search tool below to find specific information within the annual report.-
 1
1 -
2
-
3
-
4
-
5
-
6
-
7
-
8
-
9
-
10
-
11
-
12
-
13
-
14
-
15
-
16
-
17
-
18
-
19
-
20
-
21
-
22
-
23
-
24
-
25
-
26
-
27
-
28
-
29
-
30
-
31
-
32
-
33
-
34
-
35
-
36
-
37
-
38
-
39
-
40
-
41
-
42
-
43
-
44
-
45
-
46
-
47
-
48
-
49
-
50
-
51
-
52
-
53
-
54
-
55
-
56
-
57
-
58
-
59
-
60
-
61
-
62
-
63
-
64
-
65
-
66
-
67
-
68
-
69
-
70
-
71
-
72
-
73
-
74
-
75
-
76
-
77
-
78
-
79
-
80
-
81
-
82
-
83
-
84
-
85
-
86
-
87
-
88
-
89
-
90
-
91
-
92
-
93
-
94
-
95
-
96
-
97
-
98
-
99
-
100
-
101
-
102
-
103
-
104
-
105
-
106
-
107
-
108
-
109
-
110
-
111
-
112
-
113
-
114
-
115
-
116
-
117
-
118
-
119
-
120
-
121
-
122
-
123
-
124
-
125
-
126
-
127
-
128
-
 129
129 -
 130
130 -
 131
131 -
 132
132 -
 133
133 -
 134
134 -
 135
135 -
 136
136 -
 137
137 -
 138
138 -
 139
139 -
 140
140 -
 141
141 -
 142
142 -
 143
143 -
 144
144 -
 145
145 -
 146
146 -
 147
147 -
 148
148
 |
 |

Vodafone Group Plc Annual Report 2010 137
Additional information
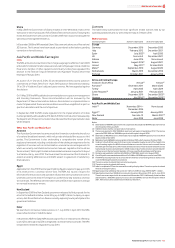
Reconciliation of organic growth to reported growth is shown where used, or in the table below:
Organic M&A Foreign Reported
change activity exchange change
% pps pps %
31 March 2010
Group
Data revenue 19.3 6.9 6.8 33.0
Fixed line revenue 7.9 6.0 6.7 20.6
Service revenue (1.6) 4.9 5.6 8.9
Europe
Enterprise revenue (4.1) –4.7 0.6
Fixed line revenue 7.7 –6.3 14.0
Service revenue for the quarter ended 31 March 2010 (1.7) (0.1) (2.0) (3.8)
Germany – service revenue for the quarter ended 31 March 2010 (1.6) – (2.4) (4.0)
Germany – fixed line revenue 1.3 –6.1 7.4
Spain – service revenue for the quarter ended 31 March 2010 (6.2) –(2.3) (8.5)
Netherlands – service revenue 3.0 – 6.4 9.4
Greece – service revenue (14.5) – 5.6 (8.9)
Portugal – service revenue (4.9) –6.1 1.2
Africa and Central Europe
Service revenue for the quarter ended 31 March 2010 2.4 45.5 8.4 56.3
Vodacom – revenue 3.2 108.6 38.5 150.3
Vodacom – data revenue 32.9 155.3 57.3 245.5
Vodacom – service revenue for the quarter ended 31 March 2010 4.6 123.7 29.3 157.6
Romania – service revenue (19.9) –5.2 (14.7)
Romania – EBITDA (26.5) –4.7 (21.8)
Turkey – service revenue 5.3 –(1.6) 3.7
Turkey – service revenue for the quarter ended 31 March 2010 31.3 –1.5 32.8
Asia Pacific and Middle East
Service revenue for the quarter ended 31 March 2010 5.0 (3.5) 5.1 6.6
India – service revenue for the quarter ended 31 March 2010 6.5 –0.1 6.6
Egypt – service revenue 1.3 –4.7 6.0
Egypt – data and fixed line revenue 64.2 –4.4 68.6
Verizon Wireless
Service revenue 6.3 11.7 5.6 23.6
Revenue 5.0 11.8 5.5 22.3
EBITDA 4.4 10.9 5.4 20.7
Group’s share of result of Verizon Wireless 8.0 2.5 5.6 16.1
31 March 2009
Group
Data revenue 25.9 0.7 17.1 43.7
Service revenue (0.3) 3.1 13.1 15.9
Pro-forma revenue 1 2 13 16
Pro-forma EBITDA (3) –13 10
Europe
Service revenue for the quarter ended 31 March 2009 (3.3) 0.1 15.7 12.5
Spain – service revenue for the quarter ended 31 March 2009 (8.6) –18.1 9.5
Other Europe – service revenue for the quarter ended 31 March 2009 (5.0) (0.3) 18.8 13.5
Africa and Central Europe
Vodacom – data revenue 59.7 –(5.0) 54.7
Asia Pacific and Middle East
Pro-forma revenue 19 310 32
Pro-forma EBITDA 7 1 10 18
India – pro-forma revenue 33 9 6 48
India – pro-forma EBITDA 69520
Australia – service revenue 6.1 0.7 6.4 13.2
Australia – EBITDA (16.9) (4.3) 4.7 (16.5)
Verizon Wireless
Service revenue 10.5 5.3 23.3 39.1
Revenue 10.4 5.2 23.3 38.9
EBITDA 13.0 4.3 23.7 41.0
Group’s share of result of Verizon Wireless 21.6 (0.7) 23.8 44.7