Vodafone 2010 Annual Report Download - page 42
Download and view the complete annual report
Please find page 42 of the 2010 Vodafone annual report below. You can navigate through the pages in the report by either clicking on the pages listed below, or by using the keyword search tool below to find specific information within the annual report.-
 1
1 -
2
-
3
-
4
-
5
-
6
-
7
-
8
-
9
-
10
-
11
-
12
-
13
-
14
-
15
-
16
-
17
-
18
-
19
-
20
-
21
-
22
-
23
-
24
-
25
-
26
-
27
-
28
-
29
-
30
-
31
-
 32
32 -
 33
33 -
 34
34 -
 35
35 -
 36
36 -
 37
37 -
 38
38 -
 39
39 -
 40
40 -
 41
41 -
 42
42 -
 43
43 -
 44
44 -
 45
45 -
 46
46 -
 47
47 -
 48
48 -
 49
49 -
 50
50 -
 51
51 -
 52
52 -
53
-
54
-
55
-
56
-
57
-
58
-
59
-
60
-
61
-
62
-
63
-
64
-
65
-
66
-
67
-
68
-
69
-
70
-
71
-
72
-
73
-
74
-
75
-
76
-
77
-
78
-
79
-
80
-
81
-
82
-
83
-
84
-
85
-
86
-
87
-
88
-
89
-
90
-
91
-
92
-
93
-
94
-
95
-
96
-
97
-
98
-
99
-
100
-
101
-
102
-
103
-
104
-
105
-
106
-
107
-
108
-
109
-
110
-
111
-
112
-
113
-
114
-
115
-
116
-
117
-
118
-
119
-
120
-
121
-
122
-
123
-
124
-
125
-
126
-
127
-
128
-
129
-
130
-
131
-
132
-
133
-
134
-
135
-
136
-
137
-
138
-
139
-
140
-
141
-
142
-
143
-
144
-
145
-
146
-
147
-
148
 |
 |

40 Vodafone Group Plc Annual Report 2010
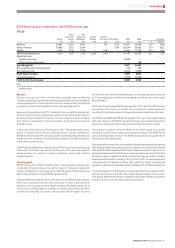
Consolidated statement of nancial position
2010 2009
£m £m
Non-current assets
Intangible assets 74,258 74,938
Property, plant and equipment 20,642 19,250
Investments in associates 36,377 34,715
Other non-current assets 11,489 10,767
142,766 139,670
Current assets 14,219 13,029
Total assets 156,985 152,699
Total equity shareholders’ funds 90,381 86,162
Total non-controlling interests 429 (1,385)
Total equity 90,810 84,777
Liabilities
Borrowings
Long-term 28,632 31,749
Short-term 11,163 9,624
Taxation liabilities
Deferred tax liabilities 7,377 6,642
Current taxation liabilities 2,874 4,552
Other non-current liabilities 1,550 1,584
Other current liabilities 14,579 13,771
Total liabilities 66,175 67,922
Total equity and liabilities 156,985 152,699
Assets
Intangible assets
At 31 March 2010 our intangible assets were £74.3 billion with goodwill comprising
the largest element at £51.8 billion (2009: £54.0 billion). The increase in intangible
assets resulting from the acquisition of Vodacom and the £1.5 billion of additions was
offset by amortisation of £3.5 billion and net impairment losses of £2.1 billion.
Property, plant and equipment
Property, plant and equipment increased from £19.3 billion at 31 March 2009 to
£20.6 billion at 31 March 2010 predominantly as a result of £5.0 billion of additions
and £1.6 billion in relation to acquisitions which more than offset the £4.5 billion of
depreciation charges.
Investments in associates
Investments in associates increased from £34.7 billion at 31 March 2009 to
£36.4 billion at 31 March 2010 mainly as a result of our share of the results of
associates, after deductions of interest, tax and non-controlling interest which
contributed £4.7 billion to the increase, mainly arising from our investment in
Verizon Wireless, and was partially offset by £1.4 billion of dividends received and
unfavourable foreign exchange movements of £1.1 billion.
Other non-current assets
Other non-current assets mainly relate to other investments which totalled £7.6
billion at 31 March 2010 compared to £7.1 billion at 31 March 2009. The increase was
primarily as a result of an increase in the listed share price of China Mobile.
Current assets
Current assets increased to £14.2 billion at 31 March 2010 from £13.0 billion at
31 March 2009.
Total equity and liabilities
Total equity shareholders’ funds
Total equity shareholders’ funds increased from £86.2 billion at 31 March 2009 to
£90.4 billion at 31 March 2010. The increase comprises primarily the profit for the
year of £8.6 billion less equity dividends of £4.1 billion.
Borrowings
Long-term borrowings and short-term borrowings decreased to £39.8 billion at
31 March 2010 from £41.4 billion at 31 March 2009 mainly as a result of foreign
exchange movements and bond repayments during the year.
Taxation liabilities
Current tax liabilities decreased from £4.6 billion at 31 March 2009 to £2.9 billion at
31 March 2010 mainly as a result of the agreement of the German tax loss claim. The
deferred tax liability increased from £6.6 billion at 31 March 2009 to £7.4 billion at
31 March 2010 mainly due to deferred tax arising on the acquisition of Vodacom.
Other current liabilities
The increase in other current liabilities from £13.8 billion at 31 March 2009 to
£14.6 billion at 31 March 2010 was primarily due to foreign exchange differences
arising on translation of liabilities in foreign subsidiaries and joint ventures. Trade
payables at 31 March 2010 were equivalent to 31 days (2009: 38 days) outstanding,
calculated by reference to the amount owed to suppliers as a proportion of the
amounts invoiced by suppliers during the year.
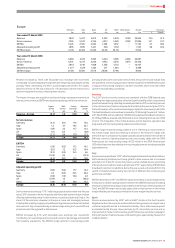
Contractual obligations and contingencies
A summary of our principal contractual financial obligations is shown below. Further
details on the items included can be found in the notes to the consolidated financial
statements. Details of the Group’s contingent liabilities are included in note 29 to the
consolidated financial statements.
Payments due by period £m
Contractual obligations(1) Total <1 year 1-3 years 3-5 years >5 years
Borrowings(2) 47,527 12,198 7, 858 9,443 18,028
Operating lease
commitments(3) 6,243 1,200 1,682 1,126 2,235
Capital
commitments(3)(4) 2,019 1,862 126 31 –
Purchase
commitments 3,372 2,216 724 189 243
Total contractual
cash obligations(1) 59,161 17,476 10,390 10,789 20,506
Notes:
(1) The above table of contractual obligations excludes commitments in respect of options
over interests in Group businesses held by non-controlling shareholders (see “Option
agreements and similar arrangements”) and obligations to pay dividends to non-controlling
shareholders (see “Dividends from associates and to non-controlling shareholders”). The
table excludes current and deferred tax liabilities and obligations under post employment
benefit schemes, details of which are provided in notes 6 and 23 to the consolidated financial
statements respectively.
(2) See note 22 to the consolidated financial statements.
(3) See note 28 to the consolidated financial statements.
(4) Primarily related to network infrastructure.
Equity dividends
The table below sets out the amounts of interim, final and total cash dividends paid
or, in the case of the final dividend for the 2010 financial year, proposed, in respect of
each financial year.
Pence per ordinary share
Year ended 31 March Interim Final Total
2006 2.20 3.87 6.07
2007 2.35 4.41 6.76
2008 2.49 5.02 7.51
2009 2.57 5.20 7.77
2010 2.66 5.65(1) 8.31
Note:
(1) The final dividend for the year ended 31 March 2010 was propos ed on 18 May 2010 and is payable
on 6 August 2010 to holders on record as of 4 June 2010. For american depositary share (‘ADS’)
holders the dividend will be payable in US dollars under the terms of the ADS depositary
agreement. Dividend payments on ordinary shares will be paid by direct credit into a nominated
bank or building society account or, alternatively, into the Company’s dividend reinvestment
plan. The Company no longer pays dividends in respect of ordinary shares by cheque.
Financial position and resources