Vodafone 2010 Annual Report Download - page 12
Download and view the complete annual report
Please find page 12 of the 2010 Vodafone annual report below. You can navigate through the pages in the report by either clicking on the pages listed below, or by using the keyword search tool below to find specific information within the annual report.-
 1
1 -
 2
2 -
 3
3 -
 4
4 -
 5
5 -
 6
6 -
 7
7 -
 8
8 -
 9
9 -
 10
10 -
 11
11 -
 12
12 -
 13
13 -
 14
14 -
 15
15 -
 16
16 -
 17
17 -
 18
18 -
 19
19 -
 20
20 -
 21
21 -
 22
22 -
23
-
24
-
25
-
26
-
27
-
28
-
29
-
30
-
31
-
32
-
33
-
34
-
35
-
36
-
37
-
38
-
39
-
40
-
41
-
42
-
43
-
44
-
45
-
46
-
47
-
48
-
49
-
50
-
51
-
52
-
53
-
54
-
55
-
56
-
57
-
58
-
59
-
60
-
61
-
62
-
63
-
64
-
65
-
66
-
67
-
68
-
69
-
70
-
71
-
72
-
73
-
74
-
75
-
76
-
77
-
78
-
79
-
80
-
81
-
82
-
83
-
84
-
85
-
86
-
87
-
88
-
89
-
90
-
91
-
92
-
93
-
94
-
95
-
96
-
97
-
98
-
99
-
100
-
101
-
102
-
103
-
104
-
105
-
106
-
107
-
108
-
109
-
110
-
111
-
112
-
113
-
114
-
115
-
116
-
117
-
118
-
119
-
120
-
121
-
122
-
123
-
124
-
125
-
126
-
127
-
128
-
129
-
130
-
131
-
132
-
133
-
134
-
135
-
136
-
137
-
138
-
139
-
140
-
141
-
142
-
143
-
144
-
145
-
146
-
147
-
148
 |
 |
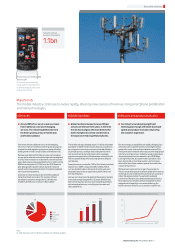
0.5
(6.8)(1.7)
8.7
2.1
Germany Italy Spain Other
UK
2.1 (1.1)
(15.8)
3.2(*)(4)
Vodacom Romania Turkey Other
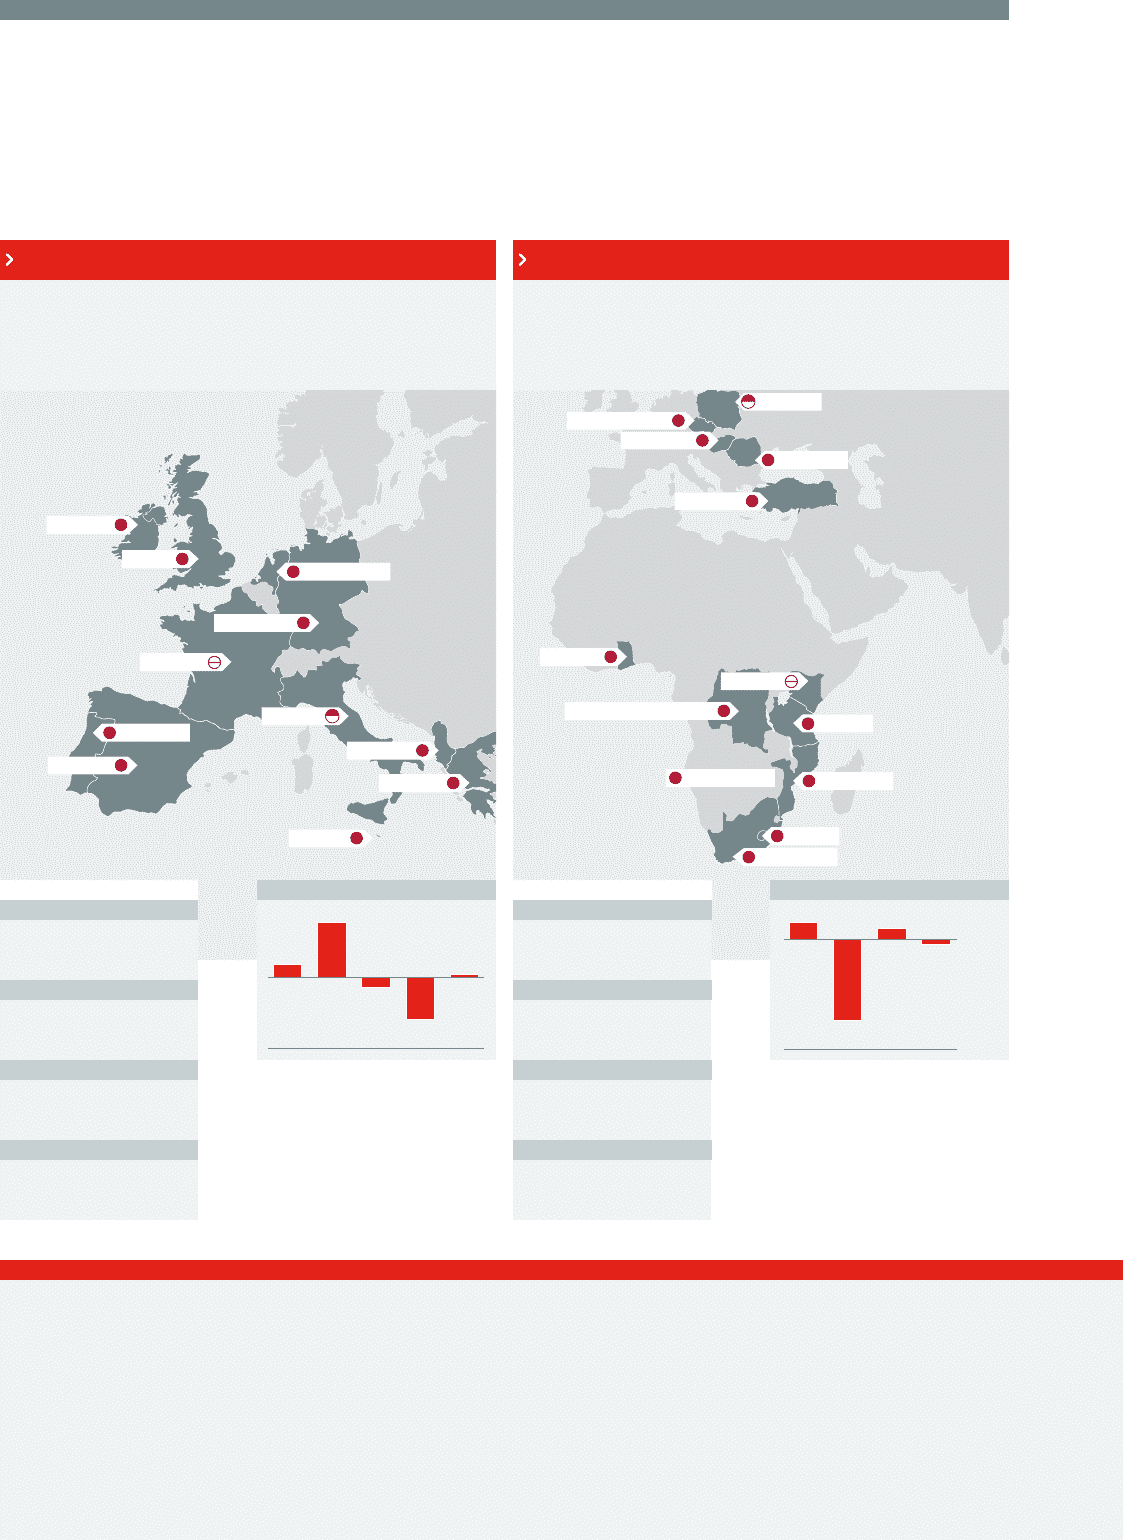
10 Vodafone Group Plc Annual Report 2010
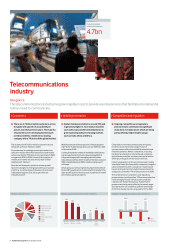
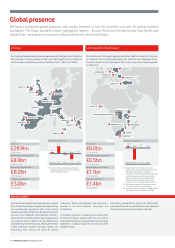
We have a signicant global presence, with equity interests in over 30 countries and over 40 partner markets
worldwide. The Group operates in three geographic regions – Europe, Africa and Central Europe, Asia Pacic and
Middle East – and has an investment in Verizon Wireless in the United States.
Our mobile subsidiaries and joint venture operate under the brand name ‘Vodafone’.
Our associate in France operates as ‘SFR’ and ‘Neuf Cegetel’, and our fixed line
communication businesses operate as ‘Vodafone’, ‘Arcor’, ‘Tele2’ and ‘TeleTu’.
Our subsidiaries in this region operate under the ‘Vodafone’ brand or, in the case
of Vodacom and its mobile subsidiaries, the ‘Vodacom’ and ‘Gateway’ brands.
Our joint venture in Poland operates as ‘Plus’ and our associate in Kenya operates
as ‘Safaricom’.
Partner markets extend our brand exposure outside
the controlled operating companies through entering
into a partnership agreement with a local mobile
operator, enabling a range of our global products and
services to be marketed in that operator’s territory.
Under the terms of these partner market agreements
we cooperate with our partners in the development
and marketing of certain services. These partnerships
create additional revenue through royalty and
franchising fees without the need for equity
investment. Similar arrangements also exist with a
number of our joint ventures, associates and
investments.
The results of partner markets are included within
Common Functions, together with the net result of
unallocated central costs and recharges to the Group’s
operations, including royalty fees for the use of the
Vodafone brand.
Partnership agreements in place at 31 March 2010,
excluding those with our joint ventures, associates and
investments, are shown in the table to the right.
(1) The sum of these amounts does not equal
Group totals due to Common Functions and
intercompany eliminations.
(2) Vodacom refers to the Group’s interest in
Vodacom Group Limited (‘Vodacom’) in South
Africa and its subsidiaries, including its
operations in the Democratic Republic of Congo,
Lesotho, Mozambique and Tanzania. It also
includes its Gateway services and business
network solutions subsidiaries which have
customers in more than 40 countries in Africa.
(3) The Group’s customers for Vodacom include
17.1 million customers in South Africa.
(4) Vodacom became a subsidiary on 18 May 2009.
The reported revenue growth was 150.3%.
Global presence
Partner markets
Europe Africa and Central Europe
Ireland 2.1m
UK 19.0m
Germany 34.5m
France 8.6m
Spain 16.7m
Albania 1.7m
Italy 23.2m
Ghana 2.8m
Turkey 15.8m
Hungary 2.6m
Czech Republic 3.0m
Kenya 5.3m
Vodacom(2) 39.9m(3)
Greece 6.0m
Portugal 6.0m
Romania 9.7m
Poland 3.3m
Netherlands 4.7m
Malta 0.2m
£29.9bn
0.8% growth
£8.0bn
45.9% growth
£6.9bn
2.9% decrease
£0.5bn
21.9% decrease
£8.2bn
2.7% decrease
£1.1bn
70.5% growth
£3.0bn
6.0% growth
£1.4bn
61.1% growth
Revenue(1)
Europe Africa and Central EuropeRevenue growth (%)
Revenue(1)
Adjusted operating profit(1) Adjusted operating profit(1)
Operating free cash flow(1) Operating free cash flow(1)
Capital expenditure(1) Capital expenditure(1)
Revenue growth (%)
Democratic Republic of Congo(2)
Mozambique(2)
Tanzania(2)
Lesotho(2)
South Africa(2)(3)