Vodafone 2010 Annual Report Download - page 7
Download and view the complete annual report
Please find page 7 of the 2010 Vodafone annual report below. You can navigate through the pages in the report by either clicking on the pages listed below, or by using the keyword search tool below to find specific information within the annual report.-
 1
1 -
 2
2 -
 3
3 -
 4
4 -
 5
5 -
 6
6 -
 7
7 -
 8
8 -
 9
9 -
 10
10 -
 11
11 -
 12
12 -
 13
13 -
 14
14 -
 15
15 -
 16
16 -
 17
17 -
 18
18 -
19
-
20
-
21
-
22
-
23
-
24
-
25
-
26
-
27
-
28
-
29
-
30
-
31
-
32
-
33
-
34
-
35
-
36
-
37
-
38
-
39
-
40
-
41
-
42
-
43
-
44
-
45
-
46
-
47
-
48
-
49
-
50
-
51
-
52
-
53
-
54
-
55
-
56
-
57
-
58
-
59
-
60
-
61
-
62
-
63
-
64
-
65
-
66
-
67
-
68
-
69
-
70
-
71
-
72
-
73
-
74
-
75
-
76
-
77
-
78
-
79
-
80
-
81
-
82
-
83
-
84
-
85
-
86
-
87
-
88
-
89
-
90
-
91
-
92
-
93
-
94
-
95
-
96
-
97
-
98
-
99
-
100
-
101
-
102
-
103
-
104
-
105
-
106
-
107
-
108
-
109
-
110
-
111
-
112
-
113
-
114
-
115
-
116
-
117
-
118
-
119
-
120
-
121
-
122
-
123
-
124
-
125
-
126
-
127
-
128
-
129
-
130
-
131
-
132
-
133
-
134
-
135
-
136
-
137
-
138
-
139
-
140
-
141
-
142
-
143
-
144
-
145
-
146
-
147
-
148
 |
 |

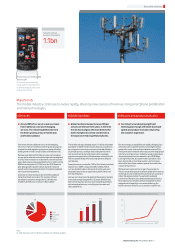
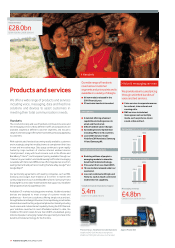
15.3
12.8
10.9
7.9
2008 200920072006
Voice
Messaging
Data
Fixed line
Other
67.1
11.5
9.7
7.9
3.8
0
7
14
21
28
2006 2010
Vodafone Group Plc Annual Report 2010 5
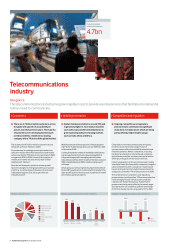
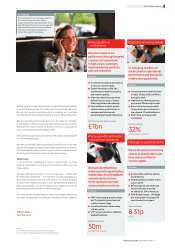
Executive summary
Around 80% of our service revenue comes
from traditional voice and messaging
services. The remaining 20% stems from
the faster growing areas of mobile data
and fixed broadband.
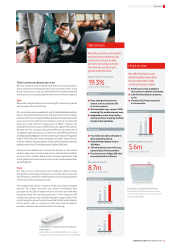
Global handset volumes increased 5% per
annum over the last three years. In this time
the mix has changed, with more demand for
both smartphones and low cost devices at
the expense of mid range feature phones.
Our industry is undergoing significant
technological change, with faster download
speeds and product innovation improving
the customer experience.
Major trends
The mobile industry continues to evolve rapidly, driven by new sources of revenue, rising smartphone proliferation
and new technologies.
Product focus: Vodafone 360
Samsung H1
Customers are increasingly
using high-end smartphones
to download applications and
browse the internet.
Service revenue (%) Vodafone mobile peak downlink speeds (Mbps)Smartphone share of global handset shipments (%)
Note:
(1) Market data sourced from Wireless intelligence and Strategy Analytics.
Services Mobile handsets Network and product evolution
Industry annual
handset shipments
1.1bn
Our revenue from traditional voice and messaging
services in mature markets is declining due to ongoing
competitive and regulatory pressures, partly offset by
faster growth in newer areas of data and fixed services.
We have seen demand for data services such as laptop
access to the internet and mobile internet browsing lead
to a four fold increase in our data traffic over the last two
years. Data revenue has expanded from £1.1 billion in the
2006 financial year to £4.1 billion in the 2010 financial
year. Data growth has been driven by faster network
speeds and increased penetration of mobile broadband
services and smartphones.
Our fixed services mainly comprise fixed broadband
rather than fixed voice calls. The number of fixed
broadband customers has grown to 5.6 million at
31 March 2010 from 2.1 million in March 2007.
The mobile industry shipped around 1.1 billion handsets
worldwide in 2009. These include ultra low cost devices
for more value conscious consumers, standard feature
2G and 3G devices, and high-end smartphones which
can access the internet and download increasingly
popular user applications. We have seen a change in mix,
with increased demand for both smartphones and low
cost devices.
Smartphones accounted for 15% of the industry handset
shipments in 2009 compared to 8% in 2006. 24% of
our new handset sales in Europe during the year were
smartphones and this is expected to grow further over
the next few years.
Our low cost devices are targeted at developing markets
and certain prepaid segments in Europe. Demand has
been driven by lower prices and an expanding portfolio
with attractive features, including touchscreen and
data capabilities.
Our technological capabilities are rapidly changing. Our
networks have evolved from 2G or second generation
systems for voice, text and basic data services to 3G or
third generation networks which also provide high speed
internet and email access. Vodafone’s peak mobile data
download speeds have increased to up to 28.8 Mbps.
Looking forward we, along with other operators, have
been testing 4G, or fourth generation, technologies
which offer even faster network speeds to enhance the
customer experience.
We have been a pioneer in a range of new products.
These include high speed mobile broadband for internet
and email access and femtocells to enhance customers’
indoor 3G signals via their household broadband
connection. We have also developed quality of service
techniques which enable careful management of the
assignment of capacity in our networks during the
busiest times to enhance our customers’ experience.