Vodafone 2010 Annual Report Download - page 10
Download and view the complete annual report
Please find page 10 of the 2010 Vodafone annual report below. You can navigate through the pages in the report by either clicking on the pages listed below, or by using the keyword search tool below to find specific information within the annual report.-
 1
1 -
 2
2 -
 3
3 -
 4
4 -
 5
5 -
 6
6 -
 7
7 -
 8
8 -
 9
9 -
 10
10 -
 11
11 -
 12
12 -
 13
13 -
 14
14 -
 15
15 -
 16
16 -
 17
17 -
 18
18 -
 19
19 -
 20
20 -
 21
21 -
22
-
23
-
24
-
25
-
26
-
27
-
28
-
29
-
30
-
31
-
32
-
33
-
34
-
35
-
36
-
37
-
38
-
39
-
40
-
41
-
42
-
43
-
44
-
45
-
46
-
47
-
48
-
49
-
50
-
51
-
52
-
53
-
54
-
55
-
56
-
57
-
58
-
59
-
60
-
61
-
62
-
63
-
64
-
65
-
66
-
67
-
68
-
69
-
70
-
71
-
72
-
73
-
74
-
75
-
76
-
77
-
78
-
79
-
80
-
81
-
82
-
83
-
84
-
85
-
86
-
87
-
88
-
89
-
90
-
91
-
92
-
93
-
94
-
95
-
96
-
97
-
98
-
99
-
100
-
101
-
102
-
103
-
104
-
105
-
106
-
107
-
108
-
109
-
110
-
111
-
112
-
113
-
114
-
115
-
116
-
117
-
118
-
119
-
120
-
121
-
122
-
123
-
124
-
125
-
126
-
127
-
128
-
129
-
130
-
131
-
132
-
133
-
134
-
135
-
136
-
137
-
138
-
139
-
140
-
141
-
142
-
143
-
144
-
145
-
146
-
147
-
148
 |
 |

8 Vodafone Group Plc Annual Report 2010
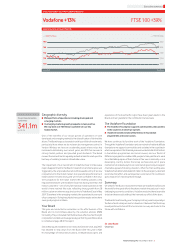
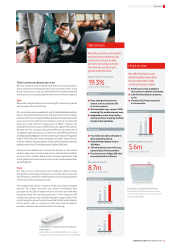
During the financial year our active data users across the Group
increased to around 50 million and within this the number of mobile
internet users to around 31 million. These achievements, while
significant, highlight the huge potential of data as we increase
penetration of the remaining part of our 341 million proportionate
customer base.
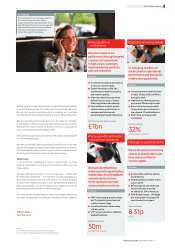
Fixed line revenue increased by 7.9%(*) during the year. We now have
5.6 million fixed broadband customers, an increase of around 1 million
during the year. In Europe EBITDA margins of the fixed activities
remained stable at around 14% and the business was broadly free cash
flow neutral after capital expenditure of approximately £450 million.
Europe’s enterprise revenue declined by 4.1%(*) during the year as a
consequence of the significant impact of the economic downturn on
our enterprise customers. In contrast Vodafone Global Enterprise, which
serves our larger enterprise customers on a Group-wide basis, had a
good year and delivered revenue growth of around 2%(*) demonstrating
the strength of Vodafone services to multinational corporations. During
the year we launched fixed mobile convergent products such as
Vodafone One Net specifically for smaller and medium enterprise
customers which will position us well for recovery in due course.
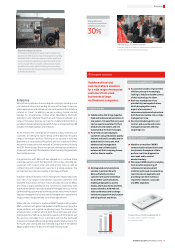
3. Execute in emerging markets
In India we have secured the number two position in the market by
revenue despite fierce price competition stimulated by new entrants.
Indus Towers is now the world’s largest tower company with over
100,000 towers under management.
Vodacom increased service revenue by 4.6%(*) and maintained its
leadership in South Africa. In Turkey service revenue increased by
31.3%(*) in the last quarter and 5.3%(*) in the full year. The turnaround
plan has brought the company back to growth and we now have to focus
on continuing this momentum in the forthcoming financial year.
While we look at opportunities to expand as they are presented, we
remain cautious with respect to future footprint expansion. Our primary
focus remains on driving results from our existing emerging markets.
4. Strengthen capital discipline to drive shareholder returns
Cash generation by the Group has been strong throughout the recession,
reflecting significant cost reductions and the success of the Group wide
working capital improvement plan in its first of two years.
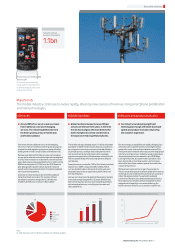
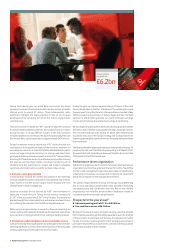
Annual capital
expenditure
£6.2bn
During the year we returned approximately £4.1 billion of free cash
flow to shareholders in the form of dividends. The remaining free cash
flow was used to fund the Vodacom stake purchase completed in May
2009 and spectrum purchases in Turkey, Egypt and Italy. Net debt
declined to £33.3 billion primarily as a result of foreign exchange
movements. The Group has retained a low single A credit rating.
We now expect that annual free cash flow for the Group will be between
£6.0 billion and £7.0 billion (using guidance foreign exchange rates) for
the next three financial years ending 31 March 2013 reflecting the
successful execution of the Group’s strategy and our expectations for
improving operating free cash flow from our emerging markets and fixed
line investments.
The Board is therefore targeting dividend per share growth of at least 7%
per annum for the next three financial years ending on 31 March 2013(1).
We expect that total dividends per share will therefore be no less than
10.18 pence for the 2013 financial year.
Performance-driven organisation
Significant changes have been made to the Group’s internal structure,
organisation and incentive systems in the last 12 months. Head office
functions and management layers have been reduced significantly,
simplifying our business processes and increasing the speed with
which we can respond to the changing environment.
The specific responsibilities of Group Technology, Group Marketing
and our local operating companies have been simplified, eliminating
overlapping areas and coordination activities. We are also shifting
progressively into incentive schemes which emphasise reward for
competitive performance and cash generation.
Prospects for the year ahead(1)
Adjusted operating profit of £11.2 to £12.0 billion.
Free cash flow in excess of £6.5 billion.
We expect the Group to return to organic revenue growth during the
2011 financial year although this will be dependent upon the strength
of the economic environment and the level of unemployment within
Europe. In contrast, revenue growth in other emerging economies, in
particular India and Africa, is expected to continue as the Group drives
penetration and data in these markets.