Vodafone 2010 Annual Report Download - page 76
Download and view the complete annual report
Please find page 76 of the 2010 Vodafone annual report below. You can navigate through the pages in the report by either clicking on the pages listed below, or by using the keyword search tool below to find specific information within the annual report.-
 1
1 -
2
-
3
-
4
-
5
-
6
-
7
-
8
-
9
-
10
-
11
-
12
-
13
-
14
-
15
-
16
-
17
-
18
-
19
-
20
-
21
-
22
-
23
-
24
-
25
-
26
-
27
-
28
-
29
-
30
-
31
-
32
-
33
-
34
-
35
-
36
-
37
-
38
-
39
-
40
-
41
-
42
-
43
-
44
-
45
-
46
-
47
-
48
-
49
-
50
-
51
-
52
-
53
-
54
-
55
-
56
-
57
-
58
-
59
-
60
-
61
-
62
-
63
-
64
-
65
-
 66
66 -
 67
67 -
 68
68 -
 69
69 -
 70
70 -
 71
71 -
 72
72 -
 73
73 -
 74
74 -
 75
75 -
 76
76 -
 77
77 -
 78
78 -
 79
79 -
 80
80 -
 81
81 -
 82
82 -
 83
83 -
 84
84 -
 85
85 -
 86
86 -
87
-
88
-
89
-
90
-
91
-
92
-
93
-
94
-
95
-
96
-
97
-
98
-
99
-
100
-
101
-
102
-
103
-
104
-
105
-
106
-
107
-
108
-
109
-
110
-
111
-
112
-
113
-
114
-
115
-
116
-
117
-
118
-
119
-
120
-
121
-
122
-
123
-
124
-
125
-
126
-
127
-
128
-
129
-
130
-
131
-
132
-
133
-
134
-
135
-
136
-
137
-
138
-
139
-
140
-
141
-
142
-
143
-
144
-
145
-
146
-
147
-
148
 |
 |

74 Vodafone Group Plc Annual Report 2010
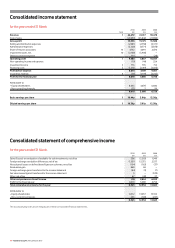
2010 2009 2008
Note £m £m £m
Revenue 3 44,472 41,017 35,478
Cost of sales (29,439) (25,842) (21,890)
Gross profit 15,033 15,175 13,588
Selling and distribution expenses (2,981) (2,738) (2,511)
Administrative expenses (5,328) (4,771) (3,878)
Share of result in associates 14 4,742 4,091 2,876
Impairment losses, net 10 (2,100) (5,900) –
Other income and expense 114 – (28)
Operating profit 4 9,480 5,857 10,047
Non-operating income and expense (10) (44) 254
Investment income 5 716 795 714
Financing costs 5 (1,512) (2,419) (2,014)
Profit before taxation 8,674 4,189 9,001
Income tax expense 6 (56) (1,109) (2,245)
Profit for the financial year 8,618 3,080 6,756
Attributable to:
– Equity shareholders 8,645 3,078 6,660
– Non-controlling interests (27) 2 96
8,618 3,080 6,756
Basic earnings per share 8 16.44p 5.84p 12.56p
Diluted earnings per share 8 16.36p 5.81p 12.50p
for the years ended 31 March
for the years ended 31 March
2010 2009 2008
£m £m £m
Gains/(losses) on revaluation of available-for-sale investments, net of tax 206 (2,383) 1,949
Foreign exchange translation differences, net of tax (1,021) 12,375 5,537
Net actuarial losses on defined benefit pension schemes, net of tax (104) (163) (37)
Revaluation gain 860 68 –
Foreign exchange gains transferred to the income statement (84) (3) (7)
Fair value losses/(gains) transferred to the income statement 3 – (570)
Other, net of tax 67 (40) 37
Other comprehensive (loss)/income (73) 9,854 6,909
Profit for the financial year 8,618 3,080 6,756
Total comprehensive income for the year 8,545 12,934 13,665
Attributable to:
– Equity shareholders 8,312 13,037 13,912
– Non-controlling interests 233 (103) (247)
8,545 12,934 13,665
The accompanying notes are an integral part of these consolidated financial statements.
Consolidated statement of comprehensive income
Consolidated income statement