Vodafone 2010 Annual Report Download - page 77
Download and view the complete annual report
Please find page 77 of the 2010 Vodafone annual report below. You can navigate through the pages in the report by either clicking on the pages listed below, or by using the keyword search tool below to find specific information within the annual report.-
 1
1 -
2
-
3
-
4
-
5
-
6
-
7
-
8
-
9
-
10
-
11
-
12
-
13
-
14
-
15
-
16
-
17
-
18
-
19
-
20
-
21
-
22
-
23
-
24
-
25
-
26
-
27
-
28
-
29
-
30
-
31
-
32
-
33
-
34
-
35
-
36
-
37
-
38
-
39
-
40
-
41
-
42
-
43
-
44
-
45
-
46
-
47
-
48
-
49
-
50
-
51
-
52
-
53
-
54
-
55
-
56
-
57
-
58
-
59
-
60
-
61
-
62
-
63
-
64
-
65
-
66
-
 67
67 -
 68
68 -
 69
69 -
 70
70 -
 71
71 -
 72
72 -
 73
73 -
 74
74 -
 75
75 -
 76
76 -
 77
77 -
 78
78 -
 79
79 -
 80
80 -
 81
81 -
 82
82 -
 83
83 -
 84
84 -
 85
85 -
 86
86 -
 87
87 -
88
-
89
-
90
-
91
-
92
-
93
-
94
-
95
-
96
-
97
-
98
-
99
-
100
-
101
-
102
-
103
-
104
-
105
-
106
-
107
-
108
-
109
-
110
-
111
-
112
-
113
-
114
-
115
-
116
-
117
-
118
-
119
-
120
-
121
-
122
-
123
-
124
-
125
-
126
-
127
-
128
-
129
-
130
-
131
-
132
-
133
-
134
-
135
-
136
-
137
-
138
-
139
-
140
-
141
-
142
-
143
-
144
-
145
-
146
-
147
-
148
 |
 |
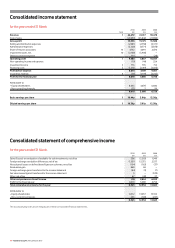
Financials
Vodafone Group Plc Annual Report 2010 75
2010 2009
Note £m £m
Non-current assets
Goodwill 9 51,838 53,958
Other intangible assets 9 22,420 20,980
Property, plant and equipment 11 20,642 19,250
Investments in associates 14 36,377 34,715
Other investments 15 7,591 7,060
Deferred tax assets 6 1,033 630
Post employment benefits 23 34 8
Trade and other receivables 17 2,831 3,069
142,766 139,670
Current assets
Inventory 16 433 412
Taxation recoverable 191 77
Trade and other receivables 17 8,784 7,662
Other investments 15 388 –
Cash and cash equivalents 18 4,423 4,878
14,219 13,029
Total assets 156,985 152,699
Equity
Called up share capital 19 4,153 4,153
Additional paid-in capital 153,509 153,348
Treasury shares (7,810) (8,036)
Retained losses (79,655) (83,820)
Accumulated other comprehensive income 20,184 20,517
Total equity shareholders’ funds 90,381 86,162
Non-controlling interests 3,379 1,787
Put options over non-controlling interests (2,950) (3,172)
Total non-controlling interests 429 (1,385)
Total equity 90,810 84,777
Non-current liabilities
Long-term borrowings 22 28,632 31,749
Deferred tax liabilities 6 7, 377 6,642
Post employment benefits 23 237 240
Provisions 24 497 533
Trade and other payables 25 816 811
37,559 39,975
Current liabilities
Short-term borrowings 22 11,163 9,624
Current taxation liabilities 2,874 4,552
Provisions 24 497 373
Trade and other payables 25 14,082 13,398
28,616 27,947
Total equity and liabilities 156,985 152,699
The consolidated financial statements were approved by the Board of directors on 18 May 2010 and were signed on its behalf by:
Vittorio Colao Andy Halford
Chief Executive Chief Financial Officer
The accompanying notes are an integral part of these consolidated financial statements.
at 31 March
Consolidated statement of nancial position