Vodafone 2010 Annual Report Download - page 39
Download and view the complete annual report
Please find page 39 of the 2010 Vodafone annual report below. You can navigate through the pages in the report by either clicking on the pages listed below, or by using the keyword search tool below to find specific information within the annual report.-
 1
1 -
2
-
3
-
4
-
5
-
6
-
7
-
8
-
9
-
10
-
11
-
12
-
13
-
14
-
15
-
16
-
17
-
18
-
19
-
20
-
21
-
22
-
23
-
24
-
25
-
26
-
27
-
28
-
 29
29 -
 30
30 -
 31
31 -
 32
32 -
 33
33 -
 34
34 -
 35
35 -
 36
36 -
 37
37 -
 38
38 -
 39
39 -
 40
40 -
 41
41 -
 42
42 -
 43
43 -
 44
44 -
 45
45 -
 46
46 -
 47
47 -
 48
48 -
 49
49 -
50
-
51
-
52
-
53
-
54
-
55
-
56
-
57
-
58
-
59
-
60
-
61
-
62
-
63
-
64
-
65
-
66
-
67
-
68
-
69
-
70
-
71
-
72
-
73
-
74
-
75
-
76
-
77
-
78
-
79
-
80
-
81
-
82
-
83
-
84
-
85
-
86
-
87
-
88
-
89
-
90
-
91
-
92
-
93
-
94
-
95
-
96
-
97
-
98
-
99
-
100
-
101
-
102
-
103
-
104
-
105
-
106
-
107
-
108
-
109
-
110
-
111
-
112
-
113
-
114
-
115
-
116
-
117
-
118
-
119
-
120
-
121
-
122
-
123
-
124
-
125
-
126
-
127
-
128
-
129
-
130
-
131
-
132
-
133
-
134
-
135
-
136
-
137
-
138
-
139
-
140
-
141
-
142
-
143
-
144
-
145
-
146
-
147
-
148
 |
 |

Performance
Vodafone Group Plc Annual Report 2010 37
2011 nancial year and three year guidance
2010
actual 2011 Three year
performance guidance guidance
£bn £bn £bn
Adjusted operating profit 11.5 11.2 – 12.0 n/a
Free cash flow 7.2
In excess
of 6.5 6.0 – 7.0
2011 nancial year
We expect the Group to return to low levels of organic revenue growth during the
2011 financial year although this will be dependent upon the strength of the
economic environment and the level of unemployment within Europe. In contrast
revenue growth in emerging economies, in particular India and Africa, is expected to
continue as the Group drives penetration and data in these markets.
EBITDA margins are expected to decline but at a significantly lower rate than that
experienced in the previous year. Adjusted operating profit is expected to be in the
range of £11.2 billion to £12.0 billion. Total depreciation and amortisation charges are
expected to be slightly higher than the prior year, before the impact of licence and
spectrum purchases, if any, during the 2011 financial year.
Free cash flow is expected to be in excess of £6.5 billion reflecting a continued but
lower level of benefit from the working capital improvement programme launched
in the 2010 financial year. We intend to maintain capital expenditure at a similar level
to last year, adjusted for foreign exchange, ensuring that we continue to invest in high
speed data networks, enhancing our customer experience and increasing the
attractiveness of the Group’s data services.
The adjusted tax rate percentage is expected to be in the mid 20s for the 2011
financial year with the Group targeting a similar level in the medium-term. The Group
continues to seek resolution of the UK Controlled Foreign Company and India
tax cases.
Three year free cash ow and dividend per share
growth target
We expect that annual free cash flow will be between £6.0 billion and £7.0 billion, in
each of the financial years in the period ending 31 March 2013, underpinning a
dividend per share growth target of at least 7% per annum for each of these financial
years. We therefore expect that total dividends per share will be no less than 10.18p
for the 2013 financial year.
Assumptions
Guidance is based on our current assessment of the global economic outlook and
assumes foreign exchange rates of £1:€1.15 and £1:US$1.50 throughout this three
year period. It excludes the impact of licence and spectrum purchases, if any, material
one-off tax settlements and restructuring costs and assumes no material change to
the current structure of the Group.
With respect to the dividend growth target, as the Group’s free cash flow is
predominantly generated by companies operating within the euro currency zone,
we have assumed that the euro to sterling rate remains within 10% of the above
guidance exchange rate.
A 1% change in the euro to sterling exchange rate would impact adjusted
operating profit by approximately £70 million and free cash flow by approximately
£60 million.
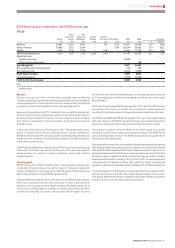
2010 nancial year
Adjusted
operating Free
profit cash flow
£bn £bn
Guidance – May 2009(1) 11.0 – 11.8 6.0 – 6.5
Guidance – February 2010(1) 11.4 – 11. 8 6.5 – 7.0
2010 actual performance 11.5 7.2
Foreign exchange 0.2 0.1
Alltel restructuring costs(2) 0.2 –
2010 performance on guidance basis 11.9 7.3
Notes:
(1) The Group’s guidance reflected assumptions for average for exchange rates for the 2010 financial
year of approximately £1:€1.12 and £1:US$1.50. Actual exchange rates were £1:€1.13 and
£1:US$1.60.
(2) The Group’s guidance did not include the impact of reorganisation costs arising from the Alltel
acquisition by Verizon Wireless.
Guidance