Vodafone 2010 Annual Report Download - page 94
Download and view the complete annual report
Please find page 94 of the 2010 Vodafone annual report below. You can navigate through the pages in the report by either clicking on the pages listed below, or by using the keyword search tool below to find specific information within the annual report.-
 1
1 -
2
-
3
-
4
-
5
-
6
-
7
-
8
-
9
-
10
-
11
-
12
-
13
-
14
-
15
-
16
-
17
-
18
-
19
-
20
-
21
-
22
-
23
-
24
-
25
-
26
-
27
-
28
-
29
-
30
-
31
-
32
-
33
-
34
-
35
-
36
-
37
-
38
-
39
-
40
-
41
-
42
-
43
-
44
-
45
-
46
-
47
-
48
-
49
-
50
-
51
-
52
-
53
-
54
-
55
-
56
-
57
-
58
-
59
-
60
-
61
-
62
-
63
-
64
-
65
-
66
-
67
-
68
-
69
-
70
-
71
-
72
-
73
-
74
-
75
-
76
-
77
-
78
-
79
-
80
-
81
-
82
-
83
-
 84
84 -
 85
85 -
 86
86 -
 87
87 -
 88
88 -
 89
89 -
 90
90 -
 91
91 -
 92
92 -
 93
93 -
 94
94 -
 95
95 -
 96
96 -
 97
97 -
 98
98 -
 99
99 -
 100
100 -
 101
101 -
 102
102 -
 103
103 -
 104
104 -
105
-
106
-
107
-
108
-
109
-
110
-
111
-
112
-
113
-
114
-
115
-
116
-
117
-
118
-
119
-
120
-
121
-
122
-
123
-
124
-
125
-
126
-
127
-
128
-
129
-
130
-
131
-
132
-
133
-
134
-
135
-
136
-
137
-
138
-
139
-
140
-
141
-
142
-
143
-
144
-
145
-
146
-
147
-
148
 |
 |

92 Vodafone Group Plc Annual Report 2010
Notes to the consolidated nancial statements continued
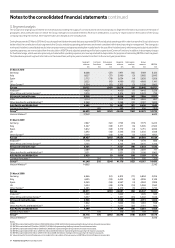
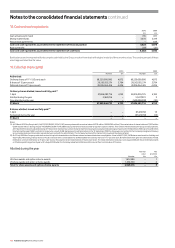
10. Impairment
Impairment losses, net
The net impairment losses recognised in the consolidated income statement, as a separate line item within operating profit, in respect of goodwill and licences and spectrum
fees are as follows:
2010 2009 2008
Cash generating unit Reportable segment £m £m £m
India India 2,300 – –
Spain Spain –3,400 –
Turkey Other Africa and Central Europe (200) 2,250 –
Ghana Other Africa and Central Europe –250 –
2,100 5,900 –
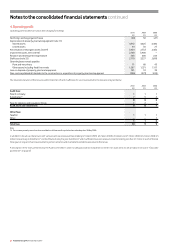
Year ended 31 March 2010
The net impairment losses were based on value in use calculations. The pre-tax adjusted discount rate used in the most recent value in use in the year ended 31 March 2010
calculation are as follows:
Pre-tax adjusted
discount rate
India 13.8%
Turkey 17.6%
India
During the year ended 31 March 2010 the goodwill in relation to the Group’s operations in India was impaired by £2,300 million primarily due to intense price competition
following the entry of a number of new operators into the market. The pre-tax risk adjusted discount rate used in the previous value in use calculation at 31 March 2009
was 12. 3%.
Turkey
During the year ended 31 March 2010 impairment losses of £200 million, previously recognised in respect of intangible assets in relation to the Group’s operations in Turkey,
were reversed. The reversal was in relation to licences and spectrum and was as a result of favourable changes in the discount rate. The cash flow projections within the
business plans used for impairment testing were substantially unchanged from those used at 31 March 2009. The pre-tax risk adjusted discount rate used in the previous
value in use calculation at 31 March 2009 was 19.5%.
Year ended 31 March 2009
The impairment losses were based on value in use calculations. The pre-tax adjusted discount rate used in the most recent value in use in the year ended 31 March 2009
calculation are as follows:
Pre-tax adjusted
discount rate
Spain 10.3%
Turkey(1) 19.5%
Ghana 26.9%
Note:
(1) The pre-tax adjusted discount rate used in the value in use calculation at 30 September 2008 was 18.6%.
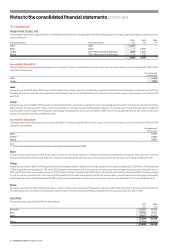
Spain
During the year ended 31 March 2009 the goodwill in relation to the Group’s operations in Spain was impaired by £3,400 million following a fall in long-term cash flow
forecasts resulting from the economic downturn. The pre-tax risk adjusted discount rate used in the previous value in use calculation at 31 January 2008 was 10.6%.
Turkey
During the year ended 31 March 2009 the goodwill and other intangible assets in relation to the Group’s operations in Turkey was impaired by £2,250 million. At 30 September
2008 the goodwill was impaired by £1,700 million following adverse movements in the discount rate and adverse performance against previous plans. During the second
half of the 2009 financial year, impairment losses of £300 million in relation to goodwill and £250 million in relation to licences and spectrum resulted from adverse changes
in both the discount rate and a fall in the long-term GDP growth rate. The cash flow projections within the business plans used for impairment testing were substantially
unchanged from those used at 30 September 2008. The pre-tax risk adjusted discount rate used in the previous value in use calculation at 31 January 2008 was 16.2%.
Ghana
During the year ended 31 March 2009 the goodwill in relation to the Group’s operations in Ghana was impaired by £250 million following an increase in the discount rate.
The cash flow projections within the business plan used for impairment testing was substantially unchanged from the acquisition business case in 2008.
Goodwill
The carrying value of goodwill at 31 March was as follows:
2010 2009
£m £m
Germany 12,301 12,786
Italy 14,786 15,361
Spain 10,167 10,561
37,254 38,708
Other 14,584 15,250
51,838 53,958