Vodafone 2010 Annual Report Download - page 89
Download and view the complete annual report
Please find page 89 of the 2010 Vodafone annual report below. You can navigate through the pages in the report by either clicking on the pages listed below, or by using the keyword search tool below to find specific information within the annual report.-
 1
1 -
2
-
3
-
4
-
5
-
6
-
7
-
8
-
9
-
10
-
11
-
12
-
13
-
14
-
15
-
16
-
17
-
18
-
19
-
20
-
21
-
22
-
23
-
24
-
25
-
26
-
27
-
28
-
29
-
30
-
31
-
32
-
33
-
34
-
35
-
36
-
37
-
38
-
39
-
40
-
41
-
42
-
43
-
44
-
45
-
46
-
47
-
48
-
49
-
50
-
51
-
52
-
53
-
54
-
55
-
56
-
57
-
58
-
59
-
60
-
61
-
62
-
63
-
64
-
65
-
66
-
67
-
68
-
69
-
70
-
71
-
72
-
73
-
74
-
75
-
76
-
77
-
78
-
 79
79 -
 80
80 -
 81
81 -
 82
82 -
 83
83 -
 84
84 -
 85
85 -
 86
86 -
 87
87 -
 88
88 -
 89
89 -
 90
90 -
 91
91 -
 92
92 -
 93
93 -
 94
94 -
 95
95 -
 96
96 -
 97
97 -
 98
98 -
 99
99 -
100
-
101
-
102
-
103
-
104
-
105
-
106
-
107
-
108
-
109
-
110
-
111
-
112
-
113
-
114
-
115
-
116
-
117
-
118
-
119
-
120
-
121
-
122
-
123
-
124
-
125
-
126
-
127
-
128
-
129
-
130
-
131
-
132
-
133
-
134
-
135
-
136
-
137
-
138
-
139
-
140
-
141
-
142
-
143
-
144
-
145
-
146
-
147
-
148
 |
 |

Financials
Vodafone Group Plc Annual Report 2010 87
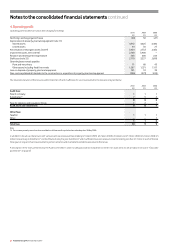
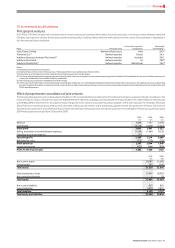
5. Investment income and nancing costs
2010 2009 2008
£m £m £m
Investment income:
Available-for-sale investments:
Dividends received 145 110 72
Loans and receivables at amortised cost 423 339 451
Fair value through the income statement (held for trading):
Derivatives – foreign exchange contracts 3 71 125
Other(1) 92 275 66
Equity put rights and similar arrangements(2) 53 – –
716 795 714
Financing costs:
Items in hedge relationships:
Other loans 888 782 612
Interest rate swaps (464) (180) 61
Dividends on redeemable preference shares 56 53 42
Fair value hedging instrument 228 (1,458) (635)
Fair value of hedged item (183) 1,475 601
Cash flow hedges transferred from equity 82 – –
Other financial liabilities held at amortised cost:
Bank loans and overdrafts 591 452 347
Other loans(3) 185 440 390
Potential interest on settlement of tax issues(4) (178) (81) 399
Equity put rights and similar arrangements(2) 94 627 143
Finance leases 717
Fair value through the income statement (held for trading):
Derivatives – forward starting swaps and futures 206 308 47
1,512 2,419 2,014
Net financing costs 796 1,624 1,300
Notes:
(1) Amounts include foreign exchange gains on certain intercompany balances and investments held following the disposal of Vodafone Japan to SoftBank.
(2) Includes amounts in relation to the Group’s arrangements with non-controlling shareholders in India. Further information is provided in “Option agreements and similar arrangements” on page 44.
(3) Amount for 2010 includes £48 million (2009: £94 million) of foreign exchange losses arising from net investments in foreign operations.
(4) Amount for 2010 and 2009 includes a reduction of the provision for potential interest on tax issues.