Vodafone 2010 Annual Report Download - page 37
Download and view the complete annual report
Please find page 37 of the 2010 Vodafone annual report below. You can navigate through the pages in the report by either clicking on the pages listed below, or by using the keyword search tool below to find specific information within the annual report.-
 1
1 -
2
-
3
-
4
-
5
-
6
-
7
-
8
-
9
-
10
-
11
-
12
-
13
-
14
-
15
-
16
-
17
-
18
-
19
-
20
-
21
-
22
-
23
-
24
-
25
-
26
-
 27
27 -
 28
28 -
 29
29 -
 30
30 -
 31
31 -
 32
32 -
 33
33 -
 34
34 -
 35
35 -
 36
36 -
 37
37 -
 38
38 -
 39
39 -
 40
40 -
 41
41 -
 42
42 -
 43
43 -
 44
44 -
 45
45 -
 46
46 -
 47
47 -
48
-
49
-
50
-
51
-
52
-
53
-
54
-
55
-
56
-
57
-
58
-
59
-
60
-
61
-
62
-
63
-
64
-
65
-
66
-
67
-
68
-
69
-
70
-
71
-
72
-
73
-
74
-
75
-
76
-
77
-
78
-
79
-
80
-
81
-
82
-
83
-
84
-
85
-
86
-
87
-
88
-
89
-
90
-
91
-
92
-
93
-
94
-
95
-
96
-
97
-
98
-
99
-
100
-
101
-
102
-
103
-
104
-
105
-
106
-
107
-
108
-
109
-
110
-
111
-
112
-
113
-
114
-
115
-
116
-
117
-
118
-
119
-
120
-
121
-
122
-
123
-
124
-
125
-
126
-
127
-
128
-
129
-
130
-
131
-
132
-
133
-
134
-
135
-
136
-
137
-
138
-
139
-
140
-
141
-
142
-
143
-
144
-
145
-
146
-
147
-
148
 |
 |

Performance
Vodafone Group Plc Annual Report 2010 35
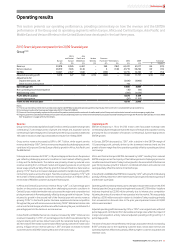
Other Africa and Central Europe
Service revenue declined by 0.9%(*) due to the performance in Turkey combined with
the impact of deteriorating economic conditions across Central Europe, most notably
in Romania in the fourth quarter. Service revenue in Turkey decreased by 7.6%(*) with
an 18.4%(*) fall in the fourth quarter. Termination rate cuts adversely impacted
revenue by 6.9% and revenue was further depressed by a higher rate of churn and a
decline in prepaid ARPU due to intense competition in the market. Consumer
confidence in Turkey fell with the deterioration in the macroeconomic environment
impacting revenue. Competition also intensified with the launch of mobile number
portability in November 2008 leading to aggressive acquisition and pricing
campaigns, especially in the fourth quarter of the year. Mobile ARPU fell in the second
half of the year but stabilised in the fourth quarter following successful promotions.
In Romania service revenue grew by 1.1%(*) but deteriorated during the year with a
10.3%(*) decline in the fourth quarter. The market continued to mature, with the
decline in ARPU resulting from local currency devaluation against the euro – whilst
tariffs are quoted in euros household incomes are earned in local currency – in
addition to market led price reductions impacting performance in the fourth quarter
in particular. These effects were partially offset by data revenue growth following
successful data promotions and flexible access offers which led to a rise in the
number of mobile PC connectivity devices.
EBITDA decreased by 6.7%(*), with the EBITDA margin also declining due to the fall in
revenue and investment in the turnaround plan in Turkey. EBITDA in Turkey declined
by 36.6%(*) as a result of the decline in revenue and increased operating expenses
reflecting higher marketing costs, higher technology costs due to expansion of the
network and organisational restructuring as part of the turnaround plan. In Romania
EBITDA decreased by 3.7%(*) as aggressive market competition and higher gross
customer additions led to the rise in the cost of acquiring and retaining customers.
In May 2008 the Group changed the consolidation status of Safaricom from a joint
venture to an associate following completion of the share allocation for the public
offering of 25.0% of Safaricom’s shares previously held by the Government of Kenya
and termination of the shareholders’ agreement with the Government of Kenya. In
August 2008 we acquired 70.0% of Ghana Telecommunications Company Limited
which offers both mobile and fixed services. We also increased our stake in Polkomtel
from 19.6% to 24.4% in December 2008.
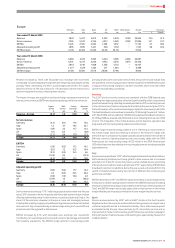
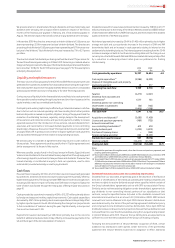
Asia Pacic and Middle East
Asia
Pacific
and
Elimi- Middle
India Other nations East % change
£m £m £m £m £Organic
Year ended
31 March 2009
Revenue 2,689 3,131 (1) 5,819 32.3 9.3
Service revenue 2,604 2,831 (1) 5,434 32.5 8.5
EBITDA 717 1,062 −1,779 18.3 6.9
Adjusted
operating
(loss)/profit (30) 586 −556 0.5 5.8
EBITDA margin 26.7% 33.9% 30.6%
Year ended
31 March 2008
Revenue 1,822 2,577 −4,399
Service revenue 1,753 2,348 −4,101
EBITDA 598 906 −1,504
Adjusted
operating profit 35 518 −553
EBITDA margin 32.8% 35.2% 34.2%
Revenue increased by 32.3%, including the contribution from favourable
exchange rate movements in addition to the benefit from acquisitions, primarily
in India. Revenue growth on a pro-forma basis was 19%, reflecting the growth in
India, Egypt and Australia. Service revenue increased by 8.5%(*) primarily as a
result of the 27.3% organic rise in the average customer base, although revenue
growth slowed as a result of stronger competition coupled with maturing
market conditions.
EBITDA grew by 18.3% with favourable exchange rate movements and the positive
impact of acquisitions contributing to the growth. On a pro-forma basis including
India, EBITDA increased by 7%. The decline in the EBITDA margin resulted from
positive performances in India and Egypt being mitigated by a decline in Australia.
The impact of merger and acquisition activity and foreign exchange movements on
revenue, service revenue, EBITDA and adjusted operating profit are shown below:
Organic M&A Foreign Reported
growth activity exchange growth
%pps pps %
Revenue
Asia Pacific and Middle East 9.3 13.3 9.7 32.3
Service revenue
India –42.5 6.0 48.5
Other 8.5 0.3 11.8 20.6
Asia Pacific and Middle East 8.5 14.2 9.8 32.5
EBITDA
India –14.1 5.8 19.9
Other 6.9 (3.4) 13.7 17.2
Asia Pacific and Middle East 6.9 0.6 10.8 18.3
Adjusted operating profit
India –(173.2) (12.5) (185.7)
Other 5.8 (6.8) 14.1 13.1
Asia Pacific and Middle East 5.8 (19.7) 14.4 0.5
India
Revenue grew by 33% on a pro-forma basis, with growth in the fourth quarter of
27.7%(*). Growth in the fourth quarter remained stable in comparison to the third
quarter as the eight percentage point benefit of the new revenue stream from the
network sharing joint venture, Indus Towers, which launched during the first half of
the 2009 financial year, offset the slowing underlying growth rate. Visitor revenue
increased, albeit at a lower rate, due to the impact of economic pressures as people
travel less. Lower effective rates per minute reflecting price reductions earlier in the
year, coupled with the continued market shift to lifetime validity prepaid offerings,
led to a reduction in customer churn. The lower effective rate and a slight fall in usage
per customer were mitigated by net customer additions, which averaged 2.1 million
per month, and the launch of services in seven new circles, bringing the closing
customer base to 68.8 million. Customer penetration in the Indian mobile market
reached 34% at 31 March 2009.
EBITDA grew by 6% on a pro-forma basis. Customer costs as a percentage of revenue
decreased, benefiting from economies of scale. Licensing costs increased as
discounts received from the regulator in some service areas were terminated.
Network expansion continued, with an average of 2,600 base stations constructed
per month, primarily in the new circles. Site sharing increased and Indus Towers
steadily increased its operations throughout the rest of the year, with 95,000 sites
under its management at the end of March 2009.