Vodafone 2010 Annual Report Download - page 31
Download and view the complete annual report
Please find page 31 of the 2010 Vodafone annual report below. You can navigate through the pages in the report by either clicking on the pages listed below, or by using the keyword search tool below to find specific information within the annual report.-
 1
1 -
2
-
3
-
4
-
5
-
6
-
7
-
8
-
9
-
10
-
11
-
12
-
13
-
14
-
15
-
16
-
17
-
18
-
19
-
20
-
 21
21 -
 22
22 -
 23
23 -
 24
24 -
 25
25 -
 26
26 -
 27
27 -
 28
28 -
 29
29 -
 30
30 -
 31
31 -
 32
32 -
 33
33 -
 34
34 -
 35
35 -
 36
36 -
 37
37 -
 38
38 -
 39
39 -
 40
40 -
 41
41 -
42
-
43
-
44
-
45
-
46
-
47
-
48
-
49
-
50
-
51
-
52
-
53
-
54
-
55
-
56
-
57
-
58
-
59
-
60
-
61
-
62
-
63
-
64
-
65
-
66
-
67
-
68
-
69
-
70
-
71
-
72
-
73
-
74
-
75
-
76
-
77
-
78
-
79
-
80
-
81
-
82
-
83
-
84
-
85
-
86
-
87
-
88
-
89
-
90
-
91
-
92
-
93
-
94
-
95
-
96
-
97
-
98
-
99
-
100
-
101
-
102
-
103
-
104
-
105
-
106
-
107
-
108
-
109
-
110
-
111
-
112
-
113
-
114
-
115
-
116
-
117
-
118
-
119
-
120
-
121
-
122
-
123
-
124
-
125
-
126
-
127
-
128
-
129
-
130
-
131
-
132
-
133
-
134
-
135
-
136
-
137
-
138
-
139
-
140
-
141
-
142
-
143
-
144
-
145
-
146
-
147
-
148
 |
 |

Performance
Vodafone Group Plc Annual Report 2010 29
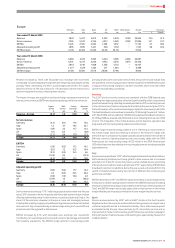
Other Africa and Central Europe
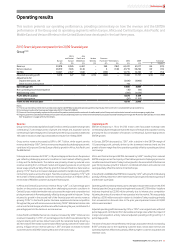
Service revenue declined by 7.0%(*) with Turkey’s return to growth in the second half
of the year being more than offset by the decline in revenue across Central Europe.
Service revenue in Turkey increased by 31.3%(*) in the fourth quarter driven by an
improving trend in outgoing mobile revenue. The quality and mix of customers
continued to improve, with Vodafone remaining the market leader in mobile number
portability in Turkey. In Romania service revenue declined by 19.9%(*) due to intense
competition throughout the year, mobile termination rate cuts and the continued
impact on ARPU resulting from local currency devaluation against the euro, as tariffs
are quoted in euros while household incomes are earned in local currency. In the
Czech Republic, Hungary and Poland, the decline in service revenue was driven by
mobile termination rate cuts which became effective during the year, impacting
incoming mobile voice revenue. In the Czech Republic and Hungary challenging
economic conditions also contributed to the decline in service revenue. Vodafone
launched its 3G network services in the Czech Republic during the fourth quarter.
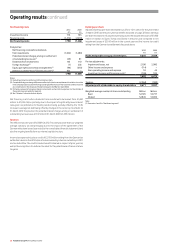
EBITDA decreased by 25.9%(*) mainly due to a reduction in service revenue coupled
with turnaround investment in Turkey and Ghana. The significant service revenue
growth in the second half of the financial year in Turkey was driven by investment and
improvement in many areas of the business. These led to higher operating costs
which, when coupled with increased interconnect costs arising from the introduction
of new “any network” tariffs plans, resulted in negative EBITDA for the financial year.
In Romania EBITDA decreased by 26.5%(*) due to the revenue decline but this was
partially of fset by strong cost reduction initiatives in all areas. Other Central European
operations benefited from a continued focus on reducing costs to mitigate the
impact of the revenue decline.
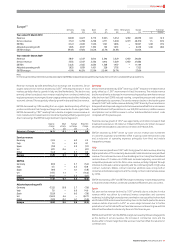
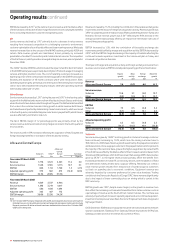
Asia Pacic and Middle East(1)
Asia
Pacific
and
Elimi- Middle
India Other nations East % change
£m £m £m £m £Organic(2)
Year ended
31 March 2010
Revenue 3,114 3,368 (1) 6,481 11.4 8.6
Service revenue 3,069 3,078 (1) 6,146 13.1 9.8
EBITDA 807 1,033 – 1,840 3.4 1.4
Adjusted
operating
(loss)/profit (37) 395 – 358 (35.6) (25.9)
EBITDA margin 25.9% 30.7% 28.4%
Year ended
31 March 2009
Revenue 2,689 3,131 (1) 5,819
Service revenue 2,604 2,831 (1) 5,434
EBITDA 717 1,062 −1,779
Adjusted
operating
(loss)/profit (30) 586 −556
EBITDA margin 26.7% 33.9% 30.6%
Notes:
(1) The Group revised how it determines and discloses segmental EBITDA and adjusted operating
profit during the year. See note 3 to the consolidated financial statements.
(2) Organic growth includes India but excludes Australia following the merger with Hutchison 3G
Australia on 9 June 2009. See “Acquisitions” on page 42 for further details.
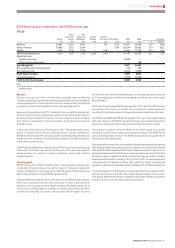
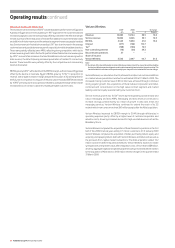
Revenue increased by 11.4% including a 7.4 percentage point benefit from foreign
exchange rate movements, offset in part by the impact of the creation of a joint
venture in June 2009 between Vodafone Australia and Hutchison 3G Australia which
is presented under the “M&A activity” column in the table below. On an organic basis
service revenue increased by 9.8%(*) reflecting a 42.2% increase in the mobile
customer base and continued strong data revenue growth partially offset by a
decline in mobile voice pricing. India contributed around 88%(*) of the region’s organic
service revenue growth.
EBITDA grew by 3.4% with a 6.4 percentage point positive contribution from foreign
exchange rate movements, offset in part by the creation of the joint venture in
Australia. On an organic basis EBITDA increased by 1.4%(*) with EBITDA margin
decreasing by 2.2 percentage points primarily reflecting the competitive pricing
environment in India and the impact of launching services in Qatar.
Organic M&A Foreign Reported
change activity exchange change
%pps pps %
Revenue
Asia Pacific and Middle East 8.6 (4.6) 7.4 11.4
Service revenue
India 14.7 – 3.2 17.9
Other 2.9 (4.5) 10.3 8.7
Asia Pacific and Middle East 9.8 (3.9) 7. 2 13.1
EBITDA
India 9.2 – 3.4 12.6
Other (4.8) (6.0) 8.1 (2.7)
Asia Pacific and Middle East 1.4 (4.4) 6.4 3.4
Adjusted operating profit
India(1) 30.7 – (7.4) 23.3
Other (23.3) (14.6) 5.3 (32.6)
Asia Pacific and Middle East (25.9) (15.2) 5.5 (35.6)
Note:
(1) The percentage change represents the increase in the adjusted operating loss.