Vodafone 2010 Annual Report Download - page 102
Download and view the complete annual report
Please find page 102 of the 2010 Vodafone annual report below. You can navigate through the pages in the report by either clicking on the pages listed below, or by using the keyword search tool below to find specific information within the annual report.-
 1
1 -
2
-
3
-
4
-
5
-
6
-
7
-
8
-
9
-
10
-
11
-
12
-
13
-
14
-
15
-
16
-
17
-
18
-
19
-
20
-
21
-
22
-
23
-
24
-
25
-
26
-
27
-
28
-
29
-
30
-
31
-
32
-
33
-
34
-
35
-
36
-
37
-
38
-
39
-
40
-
41
-
42
-
43
-
44
-
45
-
46
-
47
-
48
-
49
-
50
-
51
-
52
-
53
-
54
-
55
-
56
-
57
-
58
-
59
-
60
-
61
-
62
-
63
-
64
-
65
-
66
-
67
-
68
-
69
-
70
-
71
-
72
-
73
-
74
-
75
-
76
-
77
-
78
-
79
-
80
-
81
-
82
-
83
-
84
-
85
-
86
-
87
-
88
-
89
-
90
-
91
-
 92
92 -
 93
93 -
 94
94 -
 95
95 -
 96
96 -
 97
97 -
 98
98 -
 99
99 -
 100
100 -
 101
101 -
 102
102 -
 103
103 -
 104
104 -
 105
105 -
 106
106 -
 107
107 -
 108
108 -
 109
109 -
 110
110 -
 111
111 -
 112
112 -
113
-
114
-
115
-
116
-
117
-
118
-
119
-
120
-
121
-
122
-
123
-
124
-
125
-
126
-
127
-
128
-
129
-
130
-
131
-
132
-
133
-
134
-
135
-
136
-
137
-
138
-
139
-
140
-
141
-
142
-
143
-
144
-
145
-
146
-
147
-
148
 |
 |

100 Vodafone Group Plc Annual Report 2010
Notes to the consolidated nancial statements continued
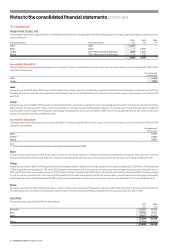
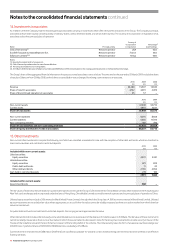
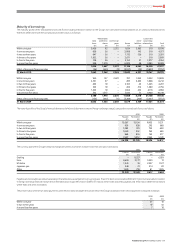
18. Cash and cash equivalents
2010 2009
£m £m
Cash at bank and in hand 745 811
Money market funds 3,678 3,419
Repurchase agreements – 648
Cash and cash equivalents as presented in the statement of financial position 4,423 4,878
Bank overdrafts (60) (32)
Cash and cash equivalents as presented in the statement of cash flows 4,363 4,846
Bank balances and money market funds comprise cash held by the Group on a short-term basis with original maturity of three months or less. The carrying amount of these
assets approximates their fair value.
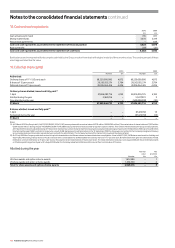
19. Called up share capital
2010 2009
Number £m Number £m
Authorised:
Ordinary shares of 113/7 US cents each 68,250,000,000 4,875 68,250,000,000 4,875
B shares of 15 pence each 38,563,935,574 5,784 38,563,935,574 5,784
Deferred shares of 15 pence each 28,036,064,426 4,206 28,036,064,426 4,206
Ordinary shares allotted, issued and fully paid:(1)
1 April 57,806,283,716 4 ,153 58,255,055,725 4 ,182
Allotted during the year 2,963,016 – 51, 227,9 91 3
Cancelled during the year – – (500,000,000) (32)
31 March 57,809,246,732 4,153 57,806,283,716 4 ,153
B shares allotted, issued and fully paid:(2)
1 April – – 87,429,138 13
Redeemed during the year – – (87,429,138) (13)
31 March – – – –
Notes:
(1) At 31 March 2010 the Group held 5,146,112,159 (2009: 5,322,411,101) treasury shares with a nominal value of £370 million (2009: £382 million). The market value of shares held was £7,822 million
(2009: £6,533 million). During the year 149,298,942 (2009: 41,146,589) treasury shares were reissued under Group share option schemes. The number of shares held by the Group as treasur y shares,
at 31 March 2010, has been adjusted down by 27 million which represents a number of shares that the Company previously reported as being purchased on the 10 September 2008, via Lehman Brothers
International (Europe) (‘LBIE’), and held in treasury. As a result of LBIE being placed in administration on the 15 September 2008 the shares were not settled to the Company’s designated treasury
account and are believed to be held in a proprietary account with the administrator. The Company has treated the transaction to buy back the shares as failed.
(2) On 31 July 2006 the Company undertook a return of capital to shareholders via a B share scheme and associated share consolidation. A total of 66,271,035,240 B shares were issued on that day, and
66,271,035,240 existing ordinary shares of 10 US cents each were consolidated into 57,987,155,835 new ordinary shares of 113/7 US cents each. B shareholders were given the alternatives of initial
redemption or future redemption at 15 pence per share or the payment of an initial dividend of 15 pence per share. The initial redemption took place on 4 August 2006 with future redemption dates
on 5 February and 5 August each year until 5 August 2008 when the Company redeemed all B shares still in issue at their nominal value of 15 pence.
Allotted during the year
Nominal Net
value proceeds
Number £m £m
UK share awards and option scheme awards 1,612,486 – 1
US share awards and option scheme awards 1,350,530 – 2
Total for share awards and option scheme awards 2,963,016 – 3