Vodafone 2010 Annual Report Download - page 45
Download and view the complete annual report
Please find page 45 of the 2010 Vodafone annual report below. You can navigate through the pages in the report by either clicking on the pages listed below, or by using the keyword search tool below to find specific information within the annual report.-
 1
1 -
2
-
3
-
4
-
5
-
6
-
7
-
8
-
9
-
10
-
11
-
12
-
13
-
14
-
15
-
16
-
17
-
18
-
19
-
20
-
21
-
22
-
23
-
24
-
25
-
26
-
27
-
28
-
29
-
30
-
31
-
32
-
33
-
34
-
 35
35 -
 36
36 -
 37
37 -
 38
38 -
 39
39 -
 40
40 -
 41
41 -
 42
42 -
 43
43 -
 44
44 -
 45
45 -
 46
46 -
 47
47 -
 48
48 -
 49
49 -
 50
50 -
 51
51 -
 52
52 -
 53
53 -
 54
54 -
 55
55 -
56
-
57
-
58
-
59
-
60
-
61
-
62
-
63
-
64
-
65
-
66
-
67
-
68
-
69
-
70
-
71
-
72
-
73
-
74
-
75
-
76
-
77
-
78
-
79
-
80
-
81
-
82
-
83
-
84
-
85
-
86
-
87
-
88
-
89
-
90
-
91
-
92
-
93
-
94
-
95
-
96
-
97
-
98
-
99
-
100
-
101
-
102
-
103
-
104
-
105
-
106
-
107
-
108
-
109
-
110
-
111
-
112
-
113
-
114
-
115
-
116
-
117
-
118
-
119
-
120
-
121
-
122
-
123
-
124
-
125
-
126
-
127
-
128
-
129
-
130
-
131
-
132
-
133
-
134
-
135
-
136
-
137
-
138
-
139
-
140
-
141
-
142
-
143
-
144
-
145
-
146
-
147
-
148
 |
 |
Performance
Vodafone Group Plc Annual Report 2010 43
At 31 March 2010 we had £4,423 million of cash and cash equivalents which are held
in accordance with our treasury policy.
We hold cash and liquid investments in accordance with the counterparty and
settlement risk limits of the Board approved treasury policy. The main forms of liquid
investments at 31 March 2010 were money market funds, commercial paper and
bank deposits.
Net debt decreased by £907 million to £33,316 million primarily due to the impact of
foreign exchange rate movements which decreased net debt by £1,038 million. The
£7,241 million free cash flow generated during the year was primarily used to fund
£4,139 million of dividend payments to shareholders, the additional stake in Vodacom
purchased during the year as well spectrum purchases in Turkey, Egypt and Italy. Net
debt represented 41.6% of our market capitalisation at 31 March 2010 compared with
53.1% at 31 March 2009. Average net debt at month end accounting dates over the
12 month period ended 31 March 2010 was £32,280 million and ranged between
£30,363 million and £34,001 million during the year.
The cash received from collateral support agreements mainly reflects the value
of our interest rate swap portfolio which is substantially net present value positive.
See note 21 to the consolidated financial statements for further details on
these agreements.
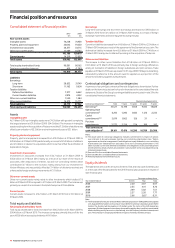
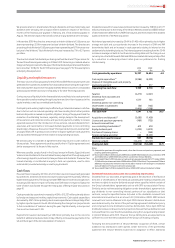
Credit ratings
Consistent with the development of our strategy we target, on average, a low single
A long-term credit rating. As of 17 May 2010 the credit ratings were as follows:
Rating agency Rating date Type of debt Rating Outlook
Standard & Poor’s 30 May 2006 Short-term A-2
30 May 2006 Long-term A- Negative
Moody’s 30 May 2006 Short-term P-2
16 May 2007 Long-term Baa1 Stable
Fitch Ratings 30 May 2006 Short-term F2
30 May 2006 Long-term A- Negative
Our credit ratings enable us to have access to a wide range of debt finance including
commercial paper, bonds and committed bank facilities. Credit ratings are not a
recommendation to purchase, hold or sell securities in as much as ratings do not
comment on market price or suitability for a particular investor and are subject to
revision or withdrawal at any time by the assigning rating organisation. Each rating
should be evaluated independently.
Commercial paper programmes
We currently have US and euro commercial paper programmes of US$15 billion and
£5 billion respectively which are available to be used to meet short-term liquidity
requirements. At 31 March 2010 amounts external to the Group of €2,491 million
(£2,219 million), £161 million and US$33 million (£22 million) were drawn under the
euro commercial paper programme and US$245 million (£161 million) was drawn
down under the US commercial paper programme, with such funds being provided
by counterparties external to the Group. At 31 March 2009 US$1,412 million (£987
million) was drawn under the US commercial paper programme and €1,340 million
(£1,239 million), £357 million and US$108 million (£76 million) was drawn under the
euro commercial paper programme. The commercial paper facilities were supported
by US$9.1 billion (£6.4 billion) of committed bank facilities (see “Committed
facilities”), comprised of a US$4.1 billion revolving credit facility that matures on 28
July 2011 and a US$5 billion revolving credit facility that matures on 22 June 2012.
At 31 March 2010 and 31 March 2009 no amounts had been drawn under either
bank facility.
Bonds
We have a €30 billion euro medium-term note programme and a US shelf programme
which are used to meet medium to long-term funding requirements. At 31 March
2010 the total amounts in issue under these programmes split by currency were
US$13.2 billion, £2.6 billion, €11.8 billion and £0.2 billion sterling equivalent of
other currencies.
In the year ended 31 March 2010 bonds with a nominal value equivalent of £3.9 billion
at the relevant 31 March 2010 exchange rates were issued under the US shelf and the
euro medium-term note programme. The bonds issued during the year were:
Nominal Sterling
amount equivalent
Date of bond issue Maturity of bond Million Million
April 2009 November 2012 €250 229
June 2009 December 2017 £600 600
June 2009 June 2014 US$1,250 780
June 2009 June 2019 US$1,250 780
November 2009 November 2015 US$500 329
January 2010 January 2022 €1,250 1,113
At 31 March 2010 we had bonds outstanding with a nominal value of £21,963 million
(2009: £23,754 million).
Committed facilities
The following table summarises the committed bank facilities available to us at
31 March 2010.
Committed bank facilities Amounts drawn
29 July 2008
US$4.1 billion revolving credit
facility, maturing 28 July 2011
No drawings have been made against
this facility. The facility supports our
commercial paper programmes and may
be used for general corporate purposes
including acquisitions.
24 June 2005
US$5 billion revolving credit
facility, maturing 22 June 2012
No drawings have been made against
this facility. The facility supports our
commercial paper programmes and may
be used for general corporate purposes
including acquisitions.
21 December 2005
¥258.5 billion term credit facility,
maturing 16 March 2011, entered
into by Vodafone Finance K.K.
and guaranteed by the Company
The facility was drawn down in full on
21 December 2005. The facility is
available for general corporate purposes,
although amounts drawn must be on-lent
to the Company.
16 November 2006
€0.4 billion loan facility,
maturing 14 February 2014
The facility was drawn down in full on
14 February 2007. The facility is available
for financing capital expenditure in our
Turkish operating company.
28 July 2008
€0.4 billion loan facility,
maturing 12 August 2015
The facility was drawn down in full on
12 August 2008. The facility is available for
financing the roll out of converged fixed
mobile broadband telecommunications.
14 September 2009
€0.4 billion loan facility, available
for 18 months, repayment is the
seventh year anniversary of the
first advance drawn within
the availability period ending
March 2011
No drawings have been made against
this facility. The facility is available for
financing capital expenditure in our
German operations.
29 September 2009
US$0.7 billion export credit
agency loan facility, maturing
16 September 2018
No drawings have been made against this
facility. The facility is available for financing
eligible Swedish goods and services.