Vodafone 2010 Annual Report Download - page 86
Download and view the complete annual report
Please find page 86 of the 2010 Vodafone annual report below. You can navigate through the pages in the report by either clicking on the pages listed below, or by using the keyword search tool below to find specific information within the annual report.-
 1
1 -
2
-
3
-
4
-
5
-
6
-
7
-
8
-
9
-
10
-
11
-
12
-
13
-
14
-
15
-
16
-
17
-
18
-
19
-
20
-
21
-
22
-
23
-
24
-
25
-
26
-
27
-
28
-
29
-
30
-
31
-
32
-
33
-
34
-
35
-
36
-
37
-
38
-
39
-
40
-
41
-
42
-
43
-
44
-
45
-
46
-
47
-
48
-
49
-
50
-
51
-
52
-
53
-
54
-
55
-
56
-
57
-
58
-
59
-
60
-
61
-
62
-
63
-
64
-
65
-
66
-
67
-
68
-
69
-
70
-
71
-
72
-
73
-
74
-
75
-
 76
76 -
 77
77 -
 78
78 -
 79
79 -
 80
80 -
 81
81 -
 82
82 -
 83
83 -
 84
84 -
 85
85 -
 86
86 -
 87
87 -
 88
88 -
 89
89 -
 90
90 -
 91
91 -
 92
92 -
 93
93 -
 94
94 -
 95
95 -
 96
96 -
97
-
98
-
99
-
100
-
101
-
102
-
103
-
104
-
105
-
106
-
107
-
108
-
109
-
110
-
111
-
112
-
113
-
114
-
115
-
116
-
117
-
118
-
119
-
120
-
121
-
122
-
123
-
124
-
125
-
126
-
127
-
128
-
129
-
130
-
131
-
132
-
133
-
134
-
135
-
136
-
137
-
138
-
139
-
140
-
141
-
142
-
143
-
144
-
145
-
146
-
147
-
148
 |
 |

84 Vodafone Group Plc Annual Report 2010
Notes to the consolidated nancial statements continued
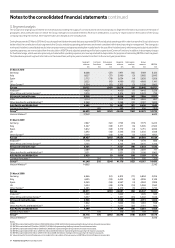
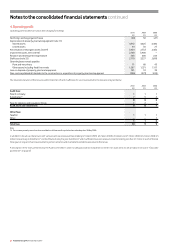
3. Segment analysis
The Group has a single group of related services and products being the supply of communications services and products. Segment information is provided on the basis of
geographic areas, being the basis on which the Group manages its worldwide interests. Revenue is attributed to a country or region based on the location of the Group
company reporting the revenue. Inter-segment sales are charged at arm’s length prices.
During the year ended 31 March 2010 the Group changed how it determines and discloses segmental EBITDA and adjusted operating profit in order to ensure the Group’s disclosures
better reflect the contribution of each segment to the Group’s underlying operating performance and remain consistent with internal reporting to management. The changes do
not impact Vodafone’s consolidated results. Intercompany revenue and expenses arising from royalty fees for the use of the Vodafone brand, which were previously included within
operating expenses, are now excluded from the calculation of EBITDA and adjusted operating profit of each segment and Common Functions. In addition, intercompany charges
for fixed asset usage, which were also previously included within operating expenses, are now reported within depreciation for purposes of calculating EBITDA of each segment.
The tables below present segment information on the revised basis, with prior years amended to conform to the current year presentation.
Segment Common Intra-region Regional Inter-region Group
revenue Functions revenue revenue revenue revenue EBITDA
£m £m £m £m £m £m £m
31 March 2010
Germany 8,008 (37) 7,971 (12) 7,959 3,122
Italy 6,027 (37) 5,990 (5) 5,985 2,843
Spain 5,713 (79) 5,634 (4) 5,630 1,956
UK 5,025 (45) 4,980 (12) 4,968 1,141
Other Europe(1) 5,354 (51) 5,303 (5) 5,298 1,865
Europe 30,127 (249) 29,878 (38) 29,840 10,927
Vodacom(2) 4,450 – 4,450 (7) 4,443 1,528
Other Africa and Central Europe(3) 3,576 – 3,576 (53) 3,523 799
Africa and Central Europe 8,026 – 8,026 (60) 7,966 2,327
India 3,114 (1) 3,113 (20) 3,093 807
Other Asia Pacific and Middle East(4) 3,368 – 3,368 (31) 3,337 1,033
Asia Pacific and Middle East 6,482 (1) 6,481 (51) 6,430 1,840
Common Functions(5) –269 –269 (33) 236 (359)
Group(6) 44,635 269 (250) 44,654 (182) 44,472 14,735
Verizon Wireless
(6)
17,222 6,689
31 March 2009
Germany 7,847 (52) 7,795 (16) 7,779 3,225
Italy 5,547 (36) 5,511 (6) 5,505 2,565
Spain 5,812 (93) 5,719 (4) 5,715 2,034
UK 5,392 (46) 5,346 (10) 5,336 1,368
Other Europe(1) 5,329 (66) 5,263 (5) 5,258 1,957
Europe 29,927 (293) 29,634 (41) 29,593 11,149
Vodacom(2) 1,778 – 1,778 –1,778 606
Other Africa and Central Europe(3) 3,723 – 3,723 (48) 3,675 1,114
Africa and Central Europe 5,501 – 5,501 (48) 5,453 1,720
India 2,689 (1) 2,688 (19) 2,669 717
Other Asia Pacific and Middle East(4) 3,131 – 3,131 (31) 3,100 1,062
Asia Pacific and Middle East 5,820 (1) 5,819 (50) 5,769 1,779
Common Functions(5) –216 –216 (14) 202 (158)
Group(6) 41,248 216 (294) 41,170 (153) 41,017 14,490
Verizon Wireless
(6)
14,085 5,543
31 March 2008
Germany 6,866 (51) 6,815 (11) 6,804 2,816
Italy 4,435 (33) 4,402 (6) 4,396 2,148
Spain 5,063 (96) 4,967 (4) 4,963 1,908
UK 5,424 (46) 5,378 (10) 5,368 1,560
Other Europe(1) 4,583 (64) 4,519 (3) 4,516 1,735
Europe 26,371 (290) 26,081 (34) 26,047 10,167
Vodacom(2) 1,609 – 1,609 –1,609 586
Other Africa and Central Europe(3) 3,337 – 3,337 (35) 3,302 1,108
Africa and Central Europe 4,946 – 4,946 (35) 4,911 1,694
India 1,822 – 1,822 (12) 1,810 598
Other Asia Pacific and Middle East(4) 2,577 – 2,577 (26) 2,551 906
Asia Pacific and Middle East 4,399 – 4,399 (38) 4,361 1,504
Common Functions(5) –170 –170 (11) 159 (187)
Group(6) 35,716 170 (290) 35,596 (118) 35,478 13,178
Verizon Wireless
(6)
10,144 3,930
Notes:
(1) EBITDA is stated before £574 million (2009: £520 million; 2008: £425 million) representing the Group’s share of results in associates.
(2) EBITDA is stated before £(2) million (2009: £(1); 2008: £nil) representing the Group’s share of results in associates.
(3) EBITDA is stated before £50 million (2009: £27; 2008: £nil) representing the Group’s share of results in associates.
(4) EBITDA is stated before £6 million (2009: £4 million; 2008: £2 million) representing the Group’s share of results in associates.
(5) EBITDA is stated before £2 million (2009: £(1) million; 2008: £2 million) relating to the Group’s share of results in associates.
(6) Values shown for Verizon Wireless are not included in the calculation of Group revenue or EBITDA as Verizon Wireless is an associate.