Vodafone 2010 Annual Report Download - page 26
Download and view the complete annual report
Please find page 26 of the 2010 Vodafone annual report below. You can navigate through the pages in the report by either clicking on the pages listed below, or by using the keyword search tool below to find specific information within the annual report.-
 1
1 -
2
-
3
-
4
-
5
-
6
-
7
-
8
-
9
-
10
-
11
-
12
-
13
-
14
-
15
-
 16
16 -
 17
17 -
 18
18 -
 19
19 -
 20
20 -
 21
21 -
 22
22 -
 23
23 -
 24
24 -
 25
25 -
 26
26 -
 27
27 -
 28
28 -
 29
29 -
 30
30 -
 31
31 -
 32
32 -
 33
33 -
 34
34 -
 35
35 -
 36
36 -
37
-
38
-
39
-
40
-
41
-
42
-
43
-
44
-
45
-
46
-
47
-
48
-
49
-
50
-
51
-
52
-
53
-
54
-
55
-
56
-
57
-
58
-
59
-
60
-
61
-
62
-
63
-
64
-
65
-
66
-
67
-
68
-
69
-
70
-
71
-
72
-
73
-
74
-
75
-
76
-
77
-
78
-
79
-
80
-
81
-
82
-
83
-
84
-
85
-
86
-
87
-
88
-
89
-
90
-
91
-
92
-
93
-
94
-
95
-
96
-
97
-
98
-
99
-
100
-
101
-
102
-
103
-
104
-
105
-
106
-
107
-
108
-
109
-
110
-
111
-
112
-
113
-
114
-
115
-
116
-
117
-
118
-
119
-
120
-
121
-
122
-
123
-
124
-
125
-
126
-
127
-
128
-
129
-
130
-
131
-
132
-
133
-
134
-
135
-
136
-
137
-
138
-
139
-
140
-
141
-
142
-
143
-
144
-
145
-
146
-
147
-
148
 |
 |
24 Vodafone Group Plc Annual Report 2010
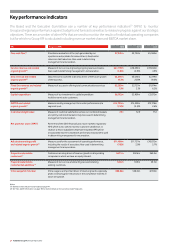
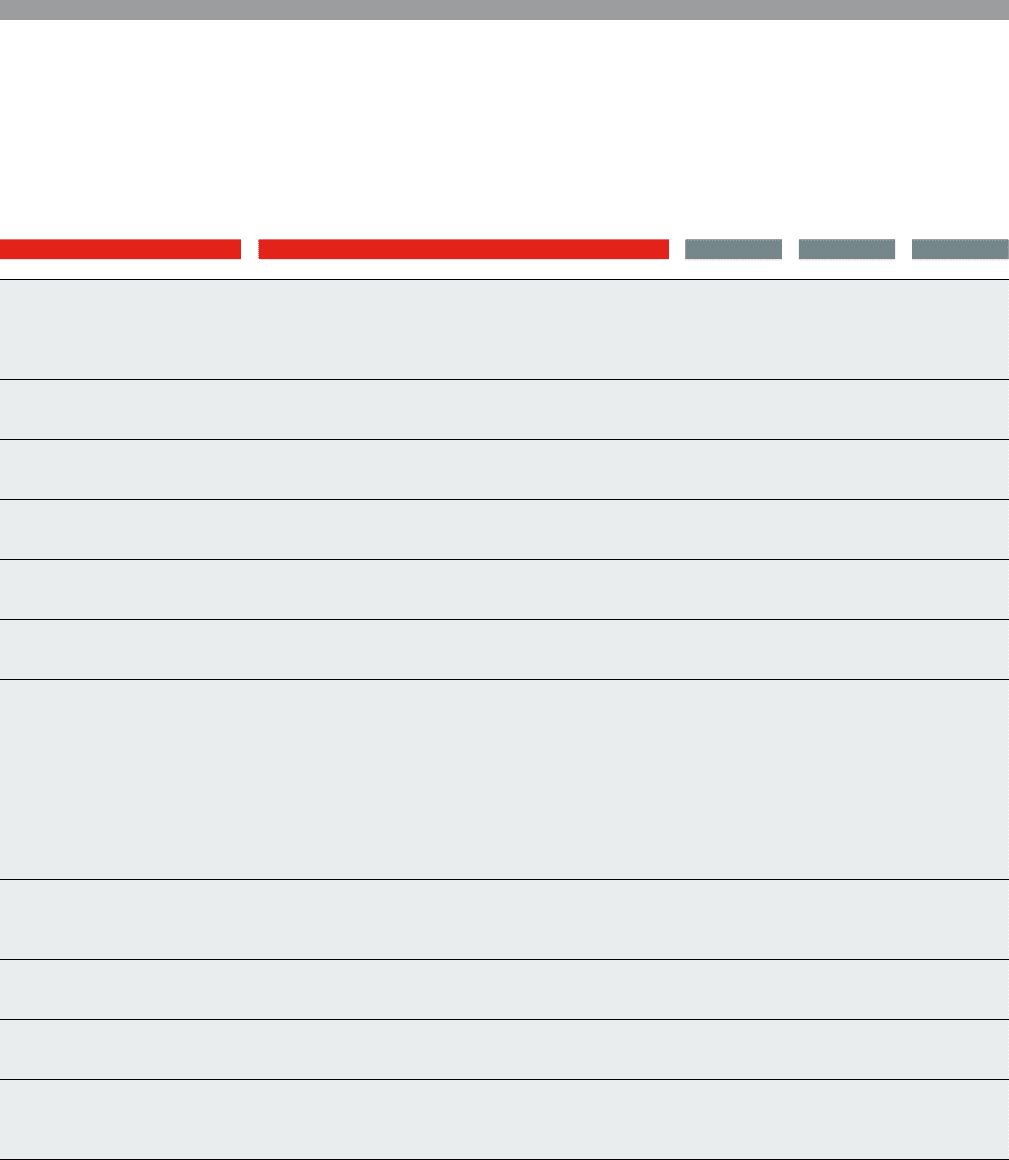
Key performance indicators
The Board and the Executive Committee use a number of key performance indicators(1) (‘KPIs’) to monitor
Group and regional performance against budgets and forecasts as well as to measure progress against our strategic
objectives. There are a number of other KPIs that are used to monitor the results of individual operating companies
but for which no Group KPI is calculated including revenue market share and EBITDA market share.
KPI Purpose of KPI 2010 2009 2008
Free cash flow(2) Provides an evaluation of the cash generated by our
operations and available for reinvestment, shareholder
returns or debt reduction. Also used in determining
management’s remuneration.
£7,241m £5,722m £5,580m
Service revenue and related
organic growth(2)
Measure of our success in growing ongoing revenue streams.
Also used in determining management’s remuneration.
£41,719m
(1.6)%
£38,294m
(0.3)%
£33,042m
4.3%
Data revenue and related
organic growth(2)
Data revenue is expected to be a key driver of the future growth
of the business.
£4,051m
19.3%
£3,046m
25.9%
£2,119m
39.0%
Fixed line revenue and related
organic growth(2)
Measure of success in offering total communications services £3,289m
7.9%
£2,727m
2.1%
£1,874m
6.2%
Capital expenditure Measure of our investment in capital expenditure
to deliver services to customers.
£6,192m £5,909m £5,075m
EBITDA and related
organic growth(2)
Measure used by management to monitor performance at a
segment level.
£14,735m
(7.4)%
£14,490m
(3.5)%
£13,178m
2.6%
Customer delight index Measure of customer satisfaction across our controlled markets
and jointly controlled market in Italy. Also used in determining
management’s remuneration.
73.1 72.9 73.1
Net promoter score (‘NPS’) At the end of the 2010 financial year, most markets migrated to
NPS, which is also used to monitor customer satisfaction. In
relation to those subsidiaries that have migrated, NPS will be
incorporated into the competitive performance assessment used
in determining management’s remuneration.
Adjusted operating profit
and related organic growth(2)
Measure used for the assessment of operating performance,
including the results of associates. Also used in determining
management’s remuneration.
£11,466m
(7.0)%
£11,757m
2.0%
£10,075m
5.7%
Proportionate mobile
customers(1)
Customers are a key driver of revenue growth in all operating
companies in which we have an equity interest.
341.1m 302.6m 260.5m
Proportionate mobile
customer net additions(1)
Measure of our success at attracting new and retaining
existing customers.
34.6m 33.6m 39.5m
Voice usage (in minutes) Voice usage is an important driver of revenue growth, especially
given continuing price reductions in the competitive markets in
which we operate.
686.6bn 548.4bn 427.9bn
Notes:
(1) Definition of the key terms is provided on page 141.
(2) See ‘Non-GAAP information’ on page 136 for further details on the use of non-GAAP measures.