Vodafone 2010 Annual Report Download - page 44
Download and view the complete annual report
Please find page 44 of the 2010 Vodafone annual report below. You can navigate through the pages in the report by either clicking on the pages listed below, or by using the keyword search tool below to find specific information within the annual report.-
 1
1 -
2
-
3
-
4
-
5
-
6
-
7
-
8
-
9
-
10
-
11
-
12
-
13
-
14
-
15
-
16
-
17
-
18
-
19
-
20
-
21
-
22
-
23
-
24
-
25
-
26
-
27
-
28
-
29
-
30
-
31
-
32
-
33
-
 34
34 -
 35
35 -
 36
36 -
 37
37 -
 38
38 -
 39
39 -
 40
40 -
 41
41 -
 42
42 -
 43
43 -
 44
44 -
 45
45 -
 46
46 -
 47
47 -
 48
48 -
 49
49 -
 50
50 -
 51
51 -
 52
52 -
 53
53 -
 54
54 -
55
-
56
-
57
-
58
-
59
-
60
-
61
-
62
-
63
-
64
-
65
-
66
-
67
-
68
-
69
-
70
-
71
-
72
-
73
-
74
-
75
-
76
-
77
-
78
-
79
-
80
-
81
-
82
-
83
-
84
-
85
-
86
-
87
-
88
-
89
-
90
-
91
-
92
-
93
-
94
-
95
-
96
-
97
-
98
-
99
-
100
-
101
-
102
-
103
-
104
-
105
-
106
-
107
-
108
-
109
-
110
-
111
-
112
-
113
-
114
-
115
-
116
-
117
-
118
-
119
-
120
-
121
-
122
-
123
-
124
-
125
-
126
-
127
-
128
-
129
-
130
-
131
-
132
-
133
-
134
-
135
-
136
-
137
-
138
-
139
-
140
-
141
-
142
-
143
-
144
-
145
-
146
-
147
-
148
 |
 |

42 Vodafone Group Plc Annual Report 2010
Financial position and resources continued
distributions above the level of the tax distributions. However the Verizon Wireless
board has agreed that it will review distributions from Verizon Wireless on an annual
basis. When considering whether distributions will be made each year, the Verizon
Wireless board will take into account its debt position, the relationship between
debt levels and maturities and overall market conditions in the context of the five
year business plan. It is expected that Verizon Wireless’ free cash flow will be
deployed in servicing and reducing debt in the near term. The 2010 financial year
benefited from a US$250 million gross tax distribution deferred from the 2009
financial year to April 2009.
During the year ended 31 March 2010 cash dividends totalling £389 million (2009:
£303 million) were received from SFR. Following SFR’s purchase of Neuf Cegetel it
was agreed that SFR would partially fund debt repayments by a reduction in
dividends between 2009 and 2011 inclusive.
Verizon Communications Inc. has an indirect 23.1% shareholding in Vodafone Italy
and under the shareholders’ agreement the shareholders have agreed to take
steps to cause Vodafone Italy to pay dividends at least annually, provided that such
dividends will not impair the financial condition or prospects of Vodafone Italy
including, without limitation, its credit standing. During the 2010 financial year
Vodafone Italy paid dividends net of withholding tax totalling €626 million to
Verizon Communications Inc.
The Vodafone Essar shareholders’ agreement provides for the payment of dividends
to non-controlling partners under certain circumstances but not before May 2011.
Given Vodacom’s strong financial position and cash flow generation, the Vodacom
board has decided to increase its dividend payout ratio from 40% to approximately
60% of headline earnings for the year ended March 2011.
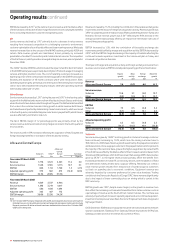
Acquisitions
We invested a net £1,777(1) million in acquisition activities during the year ended
31 March 2010. An analysis of the significant transactions in the 2010 financial year
including changes to our effective shareholding is shown in the table below.
Further details of the acquisitions are provided in note 26 to the consolidated
financial statements.
£m
Vodacom (15%) 1,577
Other net acquisitions and disposals, including investments 200
Total 1,777
Note:
(1) Amounts are shown net of cash and cash equivalents acquired or disposed.
On 20 April 2009 we acquired an additional 15.0% stake in Vodacom for cash
consideration of ZAR 20.6 billion (£1.6 billion). On 18 May 2009 Vodacom became a
subsidiary following the listing of its shares on the Johannesburg Stock Exchange and
concurrent termination of the shareholder agreement with Telkom SA Limited, the
seller and previous joint venture partner. During the period from 20 April 2009 to 18
May 2009 the Group continued to account for Vodacom as a joint venture,
proportionately consolidating 65% of the results of Vodacom.
On 10 May 2009 Vodafone Qatar completed a public offering of 40.0% of its
authorised share capital raising QAR3.4 billion (£0.6 billion). The shares were listed
on the Qatar Exchange on 22 July 2009. Qatar launched full services on its network
on 7 July 2009.
On 9 June 2009 Vodafone Australia completed its merger with Hutchison 3G Australia
to form a 50:50 joint venture, Vodafone Hutchison Australia Pty Limited, which, in due
course, will market its products and services solely under the Vodafone brand. To
equalise the value difference between the respective businesses Vodafone will
receive a deferred payment of AUS$500 million which is expected to be received in
the 2011 financial year. The combined business is proportionately consolidated as a
joint venture.
In December 2009 we acquired a 49% interest in each of two companies that hold
indirect equity interests in Vodafone Essar Limited following the partial exercise of
options which are described under “Option agreements and similar arrangements”
on page 44. As a result we increased our aggregate direct and indirect equity interest
in Vodafone Essar Limited from 51.58% to 57.59%.
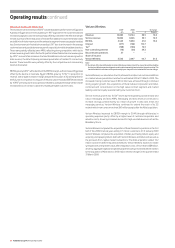
Treasury shares
The Companies Act 2006 permits companies to purchase their own shares out of
distributable reserves and to hold shares in treasury. While held in treasury, no voting
rights or pre-emption rights accrue and no dividends are paid in respect of treasury
shares. Treasury shares may be sold for cash, transferred (in certain circumstances)
for the purposes of an employee share scheme or cancelled. If treasury shares are
sold, such sales are deemed to be a new issue of shares and will accordingly count
towards the 5% of share capital which the Company is permitted to issue on a non
pre-emptive basis in any one year as approved by its shareholders at the AGM. The
proceeds of any sale of treasury shares up to the amount of the original purchase
price, calculated on a weighted average price method, is attributed to distributable
profits which would not occur in the case of the sale of non-treasury shares. Any
excess above the original purchase price must be transferred to the share premium
account. The Company did not repurchase any of its own shares between 1 April
2009 and 31 March 2010.
Shares purchased are held in treasury in accordance with sections 724 to 732 of the
Companies Act 2006. The movement in treasury shares during the 2010 financial
year is shown below:
Number
Million £m
1 April 2009 5,322 8,036
Reissue of shares (149) (189)
Other (27) (37)
31 March 2010 5,146 7,810
Funding
We have maintained a robust liquidity position throughout the year thereby enabling
us to service shareholder returns, debt and expansion through capital investment.
This position has been achieved through continued delivery of strong operating cash
flows, the impact of the working capital reduction programme, issuances on short-
term and long-term debt markets and non-recourse borrowing assumed in respect
of the emerging market business. It has not been necessary for us to draw down on
our committed bank facilities during the year.
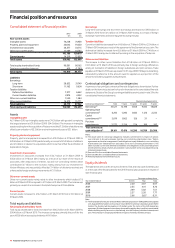
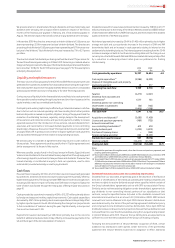
Net debt
Our consolidated net debt position at 31 March was as follows:
2010 2009
£m £m
Cash and cash equivalents(1) 4,423 4,878
Short-term borrowings:
Bonds (1,174) (5,025)
Commercial paper(2) (2,563) (2,659)
Put options over non-controlling interests (3,274) –
Bank loans (3,460) (893)
Other short-term borrowings(1) (692) (1,047)
(11,163) (9,624)
Long-term borrowings:
Put options over non-controlling interests (131) (3,606)
Bonds, loans and other long-term borrowings (28,501) (28,143)
(28,632) (31,749)
Other financial instruments(3) 2,056 2,272
Net debt (33,316) (34,223)
Notes:
(1) At 31 March 2010 the amount includes £604 million (2009: £691 million) in relation to collateral
support agreements.
(2) At 31 March 2010 US$245 million was drawn under the US commercial paper programme and
amounts of €2,491 million, £161 million and US$33 million were drawn under the euro
commercial paper programme.
(3) Comprises i) mark-to-market adjustments on derivative financial instruments which are included
as a component of trade and other receivables (2010: £2,128 million; 2009: £2,707 million) and
trade and other payables (2010: £460 million; 2009: £435 million) and ii) short-term investments
in index linked government bonds included as a component of other investments (2010: £388
million; 2009: £nil). These government bonds have less than six years to maturity, can be readily
converted into cash via the repurchase market and are held on an effective floating rate basis.