Vodafone 2010 Annual Report Download - page 43
Download and view the complete annual report
Please find page 43 of the 2010 Vodafone annual report below. You can navigate through the pages in the report by either clicking on the pages listed below, or by using the keyword search tool below to find specific information within the annual report.-
 1
1 -
2
-
3
-
4
-
5
-
6
-
7
-
8
-
9
-
10
-
11
-
12
-
13
-
14
-
15
-
16
-
17
-
18
-
19
-
20
-
21
-
22
-
23
-
24
-
25
-
26
-
27
-
28
-
29
-
30
-
31
-
32
-
 33
33 -
 34
34 -
 35
35 -
 36
36 -
 37
37 -
 38
38 -
 39
39 -
 40
40 -
 41
41 -
 42
42 -
 43
43 -
 44
44 -
 45
45 -
 46
46 -
 47
47 -
 48
48 -
 49
49 -
 50
50 -
 51
51 -
 52
52 -
 53
53 -
54
-
55
-
56
-
57
-
58
-
59
-
60
-
61
-
62
-
63
-
64
-
65
-
66
-
67
-
68
-
69
-
70
-
71
-
72
-
73
-
74
-
75
-
76
-
77
-
78
-
79
-
80
-
81
-
82
-
83
-
84
-
85
-
86
-
87
-
88
-
89
-
90
-
91
-
92
-
93
-
94
-
95
-
96
-
97
-
98
-
99
-
100
-
101
-
102
-
103
-
104
-
105
-
106
-
107
-
108
-
109
-
110
-
111
-
112
-
113
-
114
-
115
-
116
-
117
-
118
-
119
-
120
-
121
-
122
-
123
-
124
-
125
-
126
-
127
-
128
-
129
-
130
-
131
-
132
-
133
-
134
-
135
-
136
-
137
-
138
-
139
-
140
-
141
-
142
-
143
-
144
-
145
-
146
-
147
-
148
 |
 |

Performance
Vodafone Group Plc Annual Report 2010 41
We provide returns to shareholders through dividends and have historically paid
dividends semi-annually, with a regular interim dividend in respect of the first six
months of the financial year payable in February and a final dividend payable in
August. The directors expect that we will continue to pay dividends semi-annually.
In November 2009 the directors announced an interim dividend of 2.66 pence per
share representing a 3.5% increase over last year’s interim dividend. The directors are
proposing a final dividend of 5.65 pence per share representing an 8.7% increase over
last year’s final dividend. Total dividends for the year increased by 7% to 8.31 pence
per share.
The directors intend that dividend per share growth will be at least 7% per annum for
the next three financial years ending on 31 March 2013 assuming no material adverse
foreign exchange movements. We expect that total dividends per share will therefore
be no less than 10.18p for the 2013 financial year. See page 37 for the assumptions
underlying this expectation.
Liquidity and capital resources
The major sources of Group liquidity for the 2010 and 2009 financial years were cash
generated from operations, dividends from associates and borrowings through short-
term and long-term issuances in the capital markets. We do not use non-consolidated
special purpose entities as a source of liquidity or for other financing purposes.
Our key sources of liquidity for the foreseeable future are likely to be cash generated
from operations and borrowings through long-term and short-term issuances in the
capital markets as well as committed bank facilities.
Our liquidity and working capital may be affected by a material decrease in cash flow
due to factors such as reduced operating cash flow resulting from further possible
business disposals, increased competition, litigation, timing of tax payments and the
resolution of outstanding tax issues, regulatory rulings, delays in the development
of new services and networks, licence and spectrum payments, inability to receive
expected revenue from the introduction of new services, reduced dividends from
associates and investments or increased dividend payments to non-controlling
shareholders. Please see the section titled “Principal risk factors and uncertainties”
on pages 38 and 39. In particular, we continue to expect significant cash payments
and associated interest payments in relation to long standing tax issues.
We are also party to a number of agreements that may result in a cash outflow in
future periods. These agreements are discussed further in “Option agreements and
similar arrangements” at the end of this section.
Wherever possible, surplus funds in the Group (except in Albania, Egypt, India and
Vodacom) are transferred to the centralised treasury department through repayment
of borrowings, deposits, investments, share purchases and dividends. These are then
loaned internally or contributed as equity to fund our operations, used to retire
external debt, invested externally or used to pay dividends.
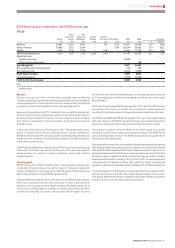
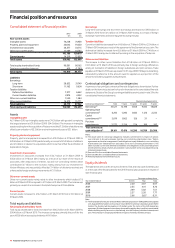
Cash ows
Free cash flow increased by 26.5% to £7,241 million due to increased cash generated
by operations, dividends received and lower taxation payments partially offset by
higher interest payments. The Group invested £989 million in licences and spectrum
including £223 million in respect of Turkey and £549 million in respect of Qatar, the
latter of which was funded through the initial public offering in Qatar discussed on
page 42.
Cash generated by operations increased by 4.8% to £15,337 million primarily driven
by foreign exchange and working capital improvements. Cash capital expenditure
decreased by £247 million primarily due to lower expenditure in India partially offset
by higher reported spend in South Africa following the change from proportionate
to full consolidation of Vodacom during the year. Capital intensity in Europe and
Common Functions was 11.3%.
Payments for taxation decreased by £148 million primarily due to the one-time
benefit of additional tax deductions in Italy offset by increased tax payments in the
US and the impact of the full consolidation of Vodacom.
Dividends received from associates and investments increased by 108.9% to £1,577
million primarily due to the timing of the Verizon Wireless dividend, US$250 million
of which had been deferred from 2009 financial year, and the increase in the dividend
agreed at the time of the Alltel acquisition.
Net interest payments increased by 20.4% to £1,406 million primarily due to higher
average net debt and a proportionate increase in the amount of ZAR and INR
denominated debt and an increase in cash payments relating to interest on the
settlement of outstanding tax issues. The interest payments resulting from the 13.4%
increase in average net debt at month end accounting dates and the change in our
currency mix of net debt towards ZAR and INR denominated debt was partially offset
by a reduction in underlying interest rates given our preference for floating
rate borrowing.
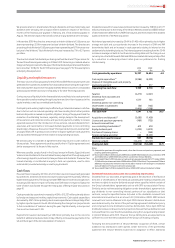
2010 2009
£m £m %
Cash generated by operations 15,337 14,634 4.8
Cash capital expenditure(1) (5,986) (6,233)
Disposal of intangible assets and property
plant and equipment 48 317
Operating free cash flow 9,399 8,718 7.8
Taxation (2,273) (2,421)
Dividends from associates and
investments(2) 1,577 755
Dividends paid to non-controlling
shareholders in subsidiaries (56) (162)
Net interest paid (1,406) (1,168)
Free cash flow 7,241 5,722 26.5
Acquisitions and disposals(3) (2,683) (1,450)
Licence and spectrum payments (989) (735)
Amounts received from
non-controlling shareholders(4) 613 618
Equity dividends paid (4,139) (4,013)
Purchase of treasury shares –(963)
Foreign exchange and other 864 (8,255)
Net debt decrease/(increase) 907 (9,076)
Opening net debt (34,223) (25,147)
Closing net debt (33,316) (34,223) (2.7)
Notes:
(1) Cash paid for purchase of intangible assets, other than licence and spectrum payments, and
property, plant and equipment.
(2) Year ended 31 March 2010 includes £389 million (2009:£303 million) from our interest in SFR
and £1,034 million (2009: £333 million) from our interest in Verizon Wireless.
(3) Year ended 31 March 2010 includes net cash and cash equivalents paid of £1,777 million (2009:
£1,360 million) and assumed debt of £906 million (2009: £78 million). The year ended 31 March
2009 also includes a £12 million increase in net debt in relation to the change in consolidation
status of Safaricom from a joint venture to an associate.
(4) Year ended 31 March 2010 includes £613 million (2009: £591 million) in relation to Qatar.
Dividends from associates and to non-controlling shareholders
Dividends from our associates are generally paid at the discretion of the Board of
directors or shareholders of the individual operating and holding companies and
we have no rights to receive dividends except where specified within certain of
the Group’s shareholders’ agreements such as with SFR, our associate in France.
Similarly, we do not have existing obligations under shareholders’ agreements to
pay dividends to non-controlling interest partners of our subsidiaries or joint
ventures, except as specified below. Included in the dividends received from
associates and investments is an amount of £1,034 million (2009: £333 million)
received from Verizon Wireless. Until April 2005 Verizon Wireless’ distributions
were determined by the terms of the partnership agreement distribution policy
and comprised income distributions and tax distributions. Since April 2005 tax
distributions have continued. Current projections forecast that tax distributions will
not be sufficient to cover the US tax liabilities arising from our partnership interest
in Verizon Wireless until 2015. However the tax distributions are expected to be
sufficient to cover the net tax liabilities of the Group’s US holding company.
Following the announcement of Verizon Wireless’ acquisition of Alltel, certain
additional tax distributions were agreed. Under the terms of the partnership
agreement the Verizon Wireless board has no obligation to effect additional