Vodafone 2010 Annual Report Download - page 11
Download and view the complete annual report
Please find page 11 of the 2010 Vodafone annual report below. You can navigate through the pages in the report by either clicking on the pages listed below, or by using the keyword search tool below to find specific information within the annual report.-
 1
1 -
 2
2 -
 3
3 -
 4
4 -
 5
5 -
 6
6 -
 7
7 -
 8
8 -
 9
9 -
 10
10 -
 11
11 -
 12
12 -
 13
13 -
 14
14 -
 15
15 -
 16
16 -
 17
17 -
 18
18 -
 19
19 -
 20
20 -
 21
21 -
 22
22 -
23
-
24
-
25
-
26
-
27
-
28
-
29
-
30
-
31
-
32
-
33
-
34
-
35
-
36
-
37
-
38
-
39
-
40
-
41
-
42
-
43
-
44
-
45
-
46
-
47
-
48
-
49
-
50
-
51
-
52
-
53
-
54
-
55
-
56
-
57
-
58
-
59
-
60
-
61
-
62
-
63
-
64
-
65
-
66
-
67
-
68
-
69
-
70
-
71
-
72
-
73
-
74
-
75
-
76
-
77
-
78
-
79
-
80
-
81
-
82
-
83
-
84
-
85
-
86
-
87
-
88
-
89
-
90
-
91
-
92
-
93
-
94
-
95
-
96
-
97
-
98
-
99
-
100
-
101
-
102
-
103
-
104
-
105
-
106
-
107
-
108
-
109
-
110
-
111
-
112
-
113
-
114
-
115
-
116
-
117
-
118
-
119
-
120
-
121
-
122
-
123
-
124
-
125
-
126
-
127
-
128
-
129
-
130
-
131
-
132
-
133
-
134
-
135
-
136
-
137
-
138
-
139
-
140
-
141
-
142
-
143
-
144
-
145
-
146
-
147
-
148
 |
 |

Vodafone Group Plc Annual Report 2010 9
Executive summary
EBITDA margins are expected to decline at a signif icantly lower rate than
in the 2010 financial year. This reflects the continuing benefit of the
Group’s cost saving programme which is enabling us to increase
commercial activity and drive increased revenue in data and fixed line.
Adjusted operating profit is expected to be in the range of £11.2 billion
to £12.0 billion. Performance will be determined by actual economic
trends and the extent to which we decide to reinvest cost savings into
total communications growth opportunities.
Free cash flow is expected to be in excess of £6.5 billion, consistent with
our new three year target.
We intend to maintain capital expenditure at a similar level to last year,
adjusted for foreign exchange, ensuring that we continue to invest in
high speed data networks, enhancing our customers’ experience and
increasing the attractiveness of the Group’s data products.
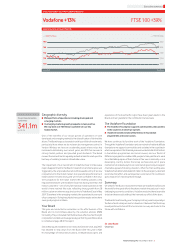
Summary
In an extremely challenging economic environment, we have
improved Vodafone’s commercial focus and cost efficiency with
visible results.
We have made good progress in our growth areas – mobile data,
broadband and enterprise – and exceeded our improved guidance,
generating strong free cash flow of £7.2 billion. As a result of greater
confidence in Vodafone’s prospects and cash generation ability, the
Board has adopted a revised dividend policy, delivering attractive
growth for shareholders over the next three years(1).
Economic growth remains fragile in many of our largest markets but
we remain confident that our strategy is creating a stronger Vodafone.
Vittorio Colao
Chief Executive
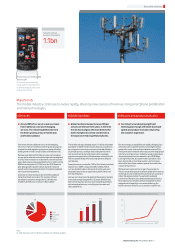
We aim to improve our
performance through targeted
commercial investment
in high value customers,
improved device portfolio
and cost reduction. In emerging markets we
are focused on operational
performance and driving the
mobile data opportunity.
We have identied three
revenue growth opportunities,
mobile data, xed broadband
and enterprise services,
which represent our total
communications services.
We are focused on enhancing
returns to shareholders and
have clear priorities for
surplus capital.
Progress
Increased smartphone penetration
across our customer base.
Capital investment of £6.2bn
to enhance our product portfolio
and network quality.
£1bn cost reduction programme
delivered a year early; a further
£1bn programme now underway.
Cost initiatives include: greater
network sharing, efficiencies in
customer self-service and
streamlining of support functions.
Our strategy
The key focus of our strategy is to drive
free cash flow generation. This is
supported by four main objectives: drive
operational performance, pursue growth
opportunities in total communications,
execute in emerging markets and
strengthen capital discipline.
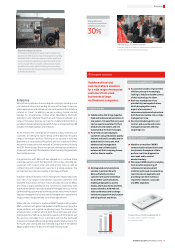
Progress
Increasing revenue market share
in India, Turkey and South Africa
during the year.
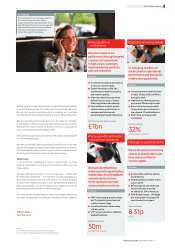
India now has 100m customers,
up a record 32m during the year.
Returned to revenue growth in
Turkey driven by investment in
the network, IT and distribution.
33% (*) data revenue growth
in Vodacom.
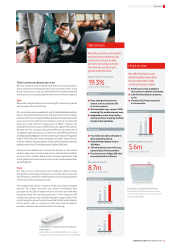
Progress
19% (*) data revenue growth; driven
by PC connectivity services and
mobile internet usage.
Fixed broadband customer base
of 5.6m, up 1m.
2% (*) revenue growth in Vodafone
Global Enterprise.
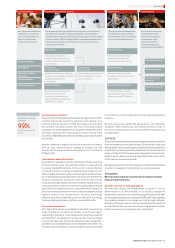
Progress
£4.1bn of free cash flow used to
pay dividends.
Total dividends per share of 8.31
pence, up 7%.
Remaining free cash flow used
to purchase spectrum and
an additional 15% of Vodacom.
New dividend target – dividends
per share growth of at least 7%
over the next three years.
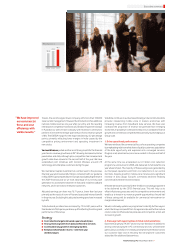
Cost savings over last two years
£1bn Service revenue
32%
from emerging markets(2)
Total dividends
8.31p
up 7%
Mobile data users
50m
up 135% over the year
Drive operational
performance
Execute in emerging markets
Pursue growth opportunities
in total communications Strengthen capital discipline
Notes:
(1) For guidance and dividend assumptions see page 37.
(2) Africa and Central Europe and Asia Pacific and Middle East.