Vodafone 2010 Annual Report Download - page 87
Download and view the complete annual report
Please find page 87 of the 2010 Vodafone annual report below. You can navigate through the pages in the report by either clicking on the pages listed below, or by using the keyword search tool below to find specific information within the annual report.-
 1
1 -
2
-
3
-
4
-
5
-
6
-
7
-
8
-
9
-
10
-
11
-
12
-
13
-
14
-
15
-
16
-
17
-
18
-
19
-
20
-
21
-
22
-
23
-
24
-
25
-
26
-
27
-
28
-
29
-
30
-
31
-
32
-
33
-
34
-
35
-
36
-
37
-
38
-
39
-
40
-
41
-
42
-
43
-
44
-
45
-
46
-
47
-
48
-
49
-
50
-
51
-
52
-
53
-
54
-
55
-
56
-
57
-
58
-
59
-
60
-
61
-
62
-
63
-
64
-
65
-
66
-
67
-
68
-
69
-
70
-
71
-
72
-
73
-
74
-
75
-
76
-
 77
77 -
 78
78 -
 79
79 -
 80
80 -
 81
81 -
 82
82 -
 83
83 -
 84
84 -
 85
85 -
 86
86 -
 87
87 -
 88
88 -
 89
89 -
 90
90 -
 91
91 -
 92
92 -
 93
93 -
 94
94 -
 95
95 -
 96
96 -
 97
97 -
98
-
99
-
100
-
101
-
102
-
103
-
104
-
105
-
106
-
107
-
108
-
109
-
110
-
111
-
112
-
113
-
114
-
115
-
116
-
117
-
118
-
119
-
120
-
121
-
122
-
123
-
124
-
125
-
126
-
127
-
128
-
129
-
130
-
131
-
132
-
133
-
134
-
135
-
136
-
137
-
138
-
139
-
140
-
141
-
142
-
143
-
144
-
145
-
146
-
147
-
148
 |
 |
Financials
Vodafone Group Plc Annual Report 2010 85
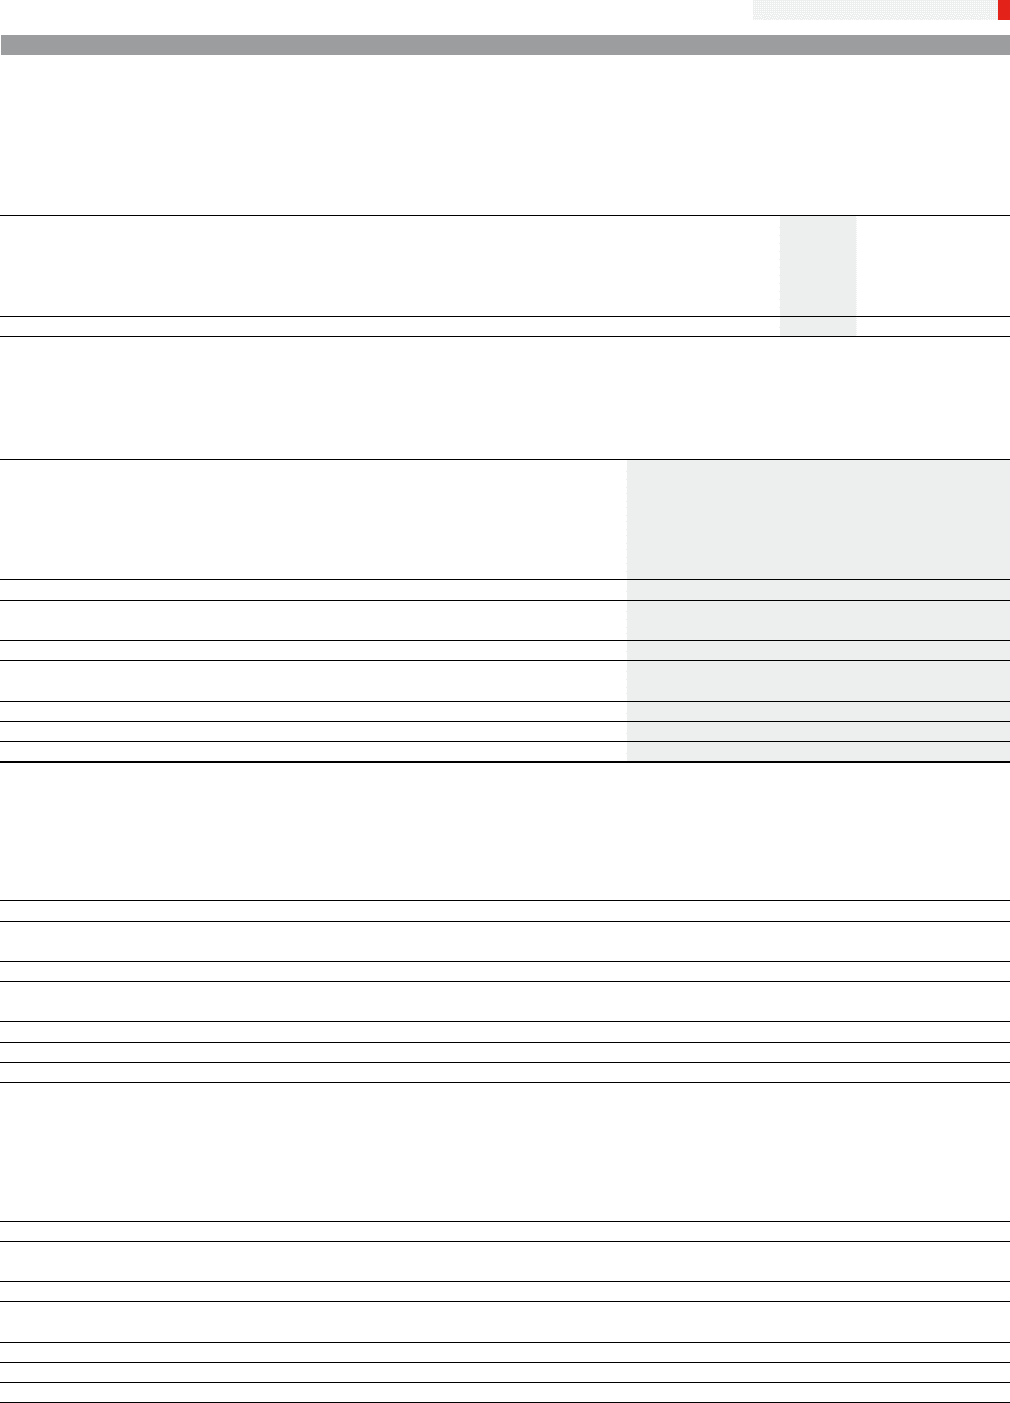
A reconciliation of EBITDA to operating profit is shown below. For a reconciliation of operating profit to profit before taxation, see the consolidated income statement on
page 74.
2010 2009 2008
£m £m £m
EBITDA 14,735 14,490 13,178
Depreciation and amortisation including loss on disposal of fixed assets (8,011) (6,824) (5,979)
Share of results in associates 4,742 4,091 2,876
Impairment losses, net (2,100) (5,900) –
Other income and expense 114 –(28)
Operating profit 9,480 5,857 10,047
Other
expenditure
on Depreciation
Non-current Capital intangible and Impairment
assets (1) expenditure(2) assets amortisation losses, net
£m £m £m £m £m
31 March 2010
Germany 20,211 766 18 1,422 –
Italy 17,941 610 60 732 –
Spain 12,746 543 – 638 –
UK 6,977 494 – 963 –
Other Europe 8,862 618 –781 –
Europe 66,737 3,031 78 4,536 –
Vodacom 7,783 520 – 1,005 –
Other Africa and Central Europe 6,357 869 228 811 (200)
Africa and Central Europe 14,140 1,389 228 1,816 (200)
India 8,665 853 – 848 2,300
Other Asia Pacific and Middle East 4,589 552 – 634 –
Asia Pacific and Middle East 13,254 1,405 – 1,482 2,300
Common Functions 769 367 19 76 –
Group 94,900 6,192 325 7,910 2,100
31 March 2009
Germany 21,617 750 16 1,378 –
Italy 18,666 521 – 735 –
Spain 13,324 632 – 606 3,400
UK 7,414 446 – 1,010 –
Other Europe 9,375 511 – 766 –
Europe 70,396 2,860 16 4,495 3,400
Vodacom 2,287 237 – 231 –
Other Africa and Central Europe 5,700 625 21 837 2,500
Africa and Central Europe 7,987 862 21 1,068 2,500
India 10,308 1,351 – 746 –
Other Asia Pacific and Middle East 4,687 524 1,101 484 –
Asia Pacific and Middle East 14,995 1,875 1,101 1,230 –
Common Functions 810 312 –21 –
Group 94,188 5,909 1,138 6,814 5,900
31 March 2008
Germany 613 14 1,229 –
Italy 411 1627 –
Spain 533 – 522 –
UK 465 – 1,016 –
Other Europe 469 11 650 –
Europe 2,491 26 4,044 –
Vodacom 204 2 219 –
Other Africa and Central Europe 702 5 698 –
Africa and Central Europe 906 7 917 –
India 1,030 –562 –
Other Asia Pacific and Middle East 463 – 394 –
Asia Pacific and Middle East 1,493 – 956 –
Common Functions 185 8 (8) –
Group 5,075 41 5,909 –
Notes:
(1) Includes goodwill, other intangible assets and property, plant and equipment.
(2) Includes additions to property, plant and equipment and computer software, reported within intangible assets.