Vodafone 2010 Annual Report Download - page 93
Download and view the complete annual report
Please find page 93 of the 2010 Vodafone annual report below. You can navigate through the pages in the report by either clicking on the pages listed below, or by using the keyword search tool below to find specific information within the annual report.-
 1
1 -
2
-
3
-
4
-
5
-
6
-
7
-
8
-
9
-
10
-
11
-
12
-
13
-
14
-
15
-
16
-
17
-
18
-
19
-
20
-
21
-
22
-
23
-
24
-
25
-
26
-
27
-
28
-
29
-
30
-
31
-
32
-
33
-
34
-
35
-
36
-
37
-
38
-
39
-
40
-
41
-
42
-
43
-
44
-
45
-
46
-
47
-
48
-
49
-
50
-
51
-
52
-
53
-
54
-
55
-
56
-
57
-
58
-
59
-
60
-
61
-
62
-
63
-
64
-
65
-
66
-
67
-
68
-
69
-
70
-
71
-
72
-
73
-
74
-
75
-
76
-
77
-
78
-
79
-
80
-
81
-
82
-
 83
83 -
 84
84 -
 85
85 -
 86
86 -
 87
87 -
 88
88 -
 89
89 -
 90
90 -
 91
91 -
 92
92 -
 93
93 -
 94
94 -
 95
95 -
 96
96 -
 97
97 -
 98
98 -
 99
99 -
 100
100 -
 101
101 -
 102
102 -
 103
103 -
104
-
105
-
106
-
107
-
108
-
109
-
110
-
111
-
112
-
113
-
114
-
115
-
116
-
117
-
118
-
119
-
120
-
121
-
122
-
123
-
124
-
125
-
126
-
127
-
128
-
129
-
130
-
131
-
132
-
133
-
134
-
135
-
136
-
137
-
138
-
139
-
140
-
141
-
142
-
143
-
144
-
145
-
146
-
147
-
148
 |
 |

Financials
Vodafone Group Plc Annual Report 2010 91
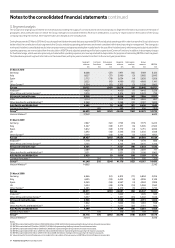
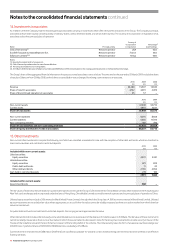
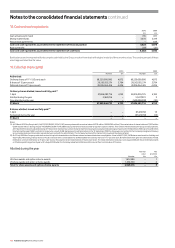
9. Intangible assets
Licences and Computer
Goodwill spectrum software Other Total
£m £m £m £m £m
Cost:
1 April 2008 91,762 22,040 5,800 1,188 120,790
Exchange movements 14,298 2,778 749 153 17,978
Arising on acquisition 613 199 69 130 1,011
Additions – 1,138 1,144 –2,282
Disposals – (1) (403) –(404)
Change in consolidation status (9) (16) – – (25)
31 March 2009 106,664 26,138 7,359 1,471 141,632
Exchange movements (2,751) 62 (72) 326 (2,435)
Arising on acquisition 1,185 1,454 153 1,604 4,396
Change in consolidation status (102) (413) (281) (175) (971)
Additions – 306 1,199 19 1,524
Disposals – – (114) –(114)
31 March 2010 104,996 27,547 8,244 3,245 144,032
Accumulated impairment losses and amortisation:
1 April 2008 40,426 5,132 4,160 741 50,459
Exchange movements 6,630 659 569 126 7,984
Amortisation charge for the year –1,522 885 346 2,753
Impairment losses 5,650 250 – – 5,900
Disposals – – (391) –(391)
Change in consolidation status – (11) – – (11)
31 March 2009 52,706 7,552 5,223 1,213 66,694
Exchange movements (1,848) (29) (104) 64 (1,917)
Amortisation charge for the year –1,730 1,046 678 3,454
Change in consolidation status – (135) (154) (181) (470)
Impairment losses, net 2,300 (200) – – 2,100
Disposals – – (87) –(87)
31 March 2010 53,158 8,918 5,924 1,774 69,774
Net book value:
31 March 2009 53,958 18,586 2,136 258 74,938
31 March 2010 51,838 18,629 2,320 1,471 74,258
For licences and spectrum and other intangible assets, amortisation is included within the cost of sales line within the consolidated income statement. Licences and
spectrum with a net book value of £2,570 million (2009: £2,765 million) have been pledged as security against borrowings.
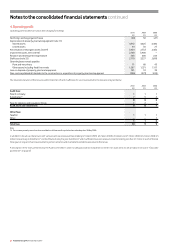
The net book value at 31 March 2010 and expiry dates of the most significant licences are as follows:
2010 2009
Expiry date £m £m
Germany December 2020 4,802 5,452
UK December 2021 3,914 4,246
Qatar June 2028 1,328 1,482
Italy December 2021 1,097 1,240