Vodafone 2010 Annual Report Download - page 144
Download and view the complete annual report
Please find page 144 of the 2010 Vodafone annual report below. You can navigate through the pages in the report by either clicking on the pages listed below, or by using the keyword search tool below to find specific information within the annual report.-
 1
1 -
2
-
3
-
4
-
5
-
6
-
7
-
8
-
9
-
10
-
11
-
12
-
13
-
14
-
15
-
16
-
17
-
18
-
19
-
20
-
21
-
22
-
23
-
24
-
25
-
26
-
27
-
28
-
29
-
30
-
31
-
32
-
33
-
34
-
35
-
36
-
37
-
38
-
39
-
40
-
41
-
42
-
43
-
44
-
45
-
46
-
47
-
48
-
49
-
50
-
51
-
52
-
53
-
54
-
55
-
56
-
57
-
58
-
59
-
60
-
61
-
62
-
63
-
64
-
65
-
66
-
67
-
68
-
69
-
70
-
71
-
72
-
73
-
74
-
75
-
76
-
77
-
78
-
79
-
80
-
81
-
82
-
83
-
84
-
85
-
86
-
87
-
88
-
89
-
90
-
91
-
92
-
93
-
94
-
95
-
96
-
97
-
98
-
99
-
100
-
101
-
102
-
103
-
104
-
105
-
106
-
107
-
108
-
109
-
110
-
111
-
112
-
113
-
114
-
115
-
116
-
117
-
118
-
119
-
120
-
121
-
122
-
123
-
124
-
125
-
126
-
127
-
128
-
129
-
130
-
131
-
132
-
133
-
 134
134 -
 135
135 -
 136
136 -
 137
137 -
 138
138 -
 139
139 -
 140
140 -
 141
141 -
 142
142 -
 143
143 -
 144
144 -
 145
145 -
 146
146 -
 147
147 -
 148
148
 |
 |

142 Vodafone Group Plc Annual Report 2010
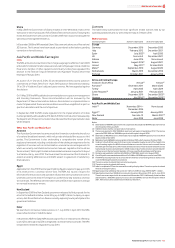
At/for the year ended 31 March 2010 2009 2008 2007 2006
Consolidated income statement data (£m)
Revenue 44,472 41,017 35,478 31,104 29,350
Operating profit/(loss) 9,480 5,857 10,047 (1,564) (14,084)
Profit/(loss) before taxation 8,674 4,189 9,001 (2,383) (14,853)
Profit/(loss) for the financial year from continuing operations 8,618 3,080 6,756 (4,806) (17,233)
Profit/(loss) for the financial year 8,618 3,080 6,756 (5,222) (20,131)
Consolidated statement of financial position data (£m)
Total assets 156,985 152,699 127, 270 109,617 126,502
Total equity 90,810 84,777 76,471 67,293 85,312
Total equity shareholders’ funds 90,381 86,162 78,043 67,067 85,425
Earnings per share(1)
Weighted average number of shares (millions)
– Basic 52,595 52,737 53,019 55,144 62,607
– Diluted 52,849 52,969 53,287 55,144 62,607
Basic earnings/(loss) per ordinary share (pence)
– Profit/(loss) from continuing operations 16.44p 5.84p 12.56p (8.94)p (27.66)p
– Profit/(loss) for the financial year 16.44p 5.84p 12.56p (9.70)p (32.31)p
Diluted earnings/(loss) per ordinary share
– Profit/(loss) from continuing operations 16.36p 5.81p 12.50p (8.94)p (27.66)p
– Profit/(loss) for the financial year 16.36p 5.81p 12.50p (9.70)p (32.31)p
Cash dividends(1)(2)
Amount per ordinary share (pence) 8.31p 7.77p 7.51p 6.76p 6.07p
Amount per ADS (pence) 83.1p 77.7p 75.1p 67.6p 60.7p
Amount per ordinary share (US cents) 12.62c 11.11c 14.91c 13.28c 10.56c
Amount per ADS (US cents) 126.2c 111.1c 149.1c 132.8c 105.6c
Other data
Ratio of earnings to fixed charges(3) 3.6 1.2 3.9 – –
Ratio of earnings to fixed charges deficit(3) –––(4,389) (16,520)
Notes:
(1) See note 8 to the consolidated financial statements, “Earnings per share”. Earnings and dividends per ADS is calculated by multiplying earnings per ordinary share by ten, the number of ordinary shares
per ADS. Dividend per ADS is calculated on the same basis.
(2) The final div idend for the year end ed 31 Mar ch 2010 was pr oposed by the directors on 18 May 2010 and is payable on 6 Augus t 2010 to holders of record as of 4 J une 2010. The total divide nds have been
translated into US dollars at 31 March 2010 for purposes of the above disclosure but the dividends are payable in US dollars under the terms of the ADS depositary agreement.
(3) For the purposes of calculating these ratios, earnings consist of profit before tax adjusted for fixed charges, dividend income from associates, share of profits and losses from associates and profits and
losses on ordinary activities before taxation from discontinued operations. Fixed charges comprise one third of payments under operating leases, representing the estimated interest element of these
payments, interest payable and similar charges and preferred share dividends.
Selected nancial data