Vodafone 2010 Annual Report Download - page 30
Download and view the complete annual report
Please find page 30 of the 2010 Vodafone annual report below. You can navigate through the pages in the report by either clicking on the pages listed below, or by using the keyword search tool below to find specific information within the annual report.-
 1
1 -
2
-
3
-
4
-
5
-
6
-
7
-
8
-
9
-
10
-
11
-
12
-
13
-
14
-
15
-
16
-
17
-
18
-
19
-
 20
20 -
 21
21 -
 22
22 -
 23
23 -
 24
24 -
 25
25 -
 26
26 -
 27
27 -
 28
28 -
 29
29 -
 30
30 -
 31
31 -
 32
32 -
 33
33 -
 34
34 -
 35
35 -
 36
36 -
 37
37 -
 38
38 -
 39
39 -
 40
40 -
41
-
42
-
43
-
44
-
45
-
46
-
47
-
48
-
49
-
50
-
51
-
52
-
53
-
54
-
55
-
56
-
57
-
58
-
59
-
60
-
61
-
62
-
63
-
64
-
65
-
66
-
67
-
68
-
69
-
70
-
71
-
72
-
73
-
74
-
75
-
76
-
77
-
78
-
79
-
80
-
81
-
82
-
83
-
84
-
85
-
86
-
87
-
88
-
89
-
90
-
91
-
92
-
93
-
94
-
95
-
96
-
97
-
98
-
99
-
100
-
101
-
102
-
103
-
104
-
105
-
106
-
107
-
108
-
109
-
110
-
111
-
112
-
113
-
114
-
115
-
116
-
117
-
118
-
119
-
120
-
121
-
122
-
123
-
124
-
125
-
126
-
127
-
128
-
129
-
130
-
131
-
132
-
133
-
134
-
135
-
136
-
137
-
138
-
139
-
140
-
141
-
142
-
143
-
144
-
145
-
146
-
147
-
148
 |
 |

28 Vodafone Group Plc Annual Report 2010
Operating results continued
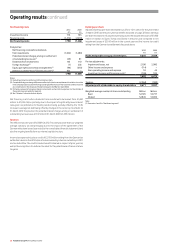
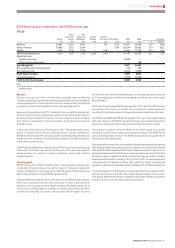
UK
Service revenue declined by 4.7%(*) with lower voice revenue primarily due to a
mobile termination rate reduction effective from July 2009, continued intense
competition and economic pressures resulting in customers optimising bundle
usage and lower roaming revenue. These were partially offset by higher messaging
revenue, strong growth in data revenue driven by the success of mobile internet
bundles and higher wholesale revenue derived from existing MVNO agreements. The
decline in the fourth quarter slowed to 2.6%(*) driven by higher data growth and the
impact of mobile customer additions achieved through the launch of new products
and expanded indirect distribution channels.
The 17.7%(*) decline in EBITDA was primarily due to lower service revenue and
increased customer investment partially offset by cost efficiency initiatives, including
streamlined processes, outsourcing and reductions in publicity and consultancy.
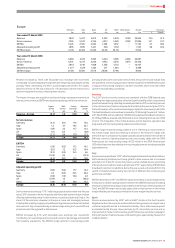
Other Europe
Service revenue decreased by 5.4%(*) with declines in all countries except the
Netherlands as all markets were impacted by the economic downturn. In the
Netherlands service revenue increased 3.0%(*) benefiting from strong growth in
visitor revenue. Service revenue in Greece declined by 14.5%(*) primarily due to a
mobile termination rate cut effective from January 2009, tariff changes and a
particularly tough economic and competitive climate. Service revenue in Ireland
declined due to a combination of recessionary and competitive factors. In Portugal
there was a termination rate reduction effective from April 2009 which contributed
to a fall in service revenue of 4.9%(*).
EBITDA declined by 10.2%(*). The EBITDA margin fell by 1.9 percentage points
with declines in all markets except the Netherlands and Portugal. The decline in
service revenue was partially offset by lower customer costs and a reduction in
operating expenses.
The share of profit in SFR increased reflecting the foreign exchange benefits upon
translation of the results into sterling.
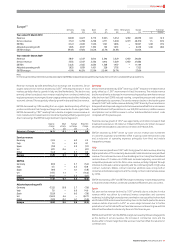
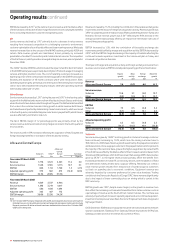
Africa and Central Europe(1)
Africa and
Central
Vodacom Other Europe % change
£m £m £m £Organic(2)
Year ended 31 March 2010
Revenue 4,450 3,576 8,026 45.9 (2.1)
Service revenue 3,954 3,451 7, 405 44.8 (1.2)
EBITDA 1,528 799 2,327 35.3 (5.8)
Adjusted operating profit 520 7 527 (21.9) (7.9)
EBITDA margin 34.3% 22.3% 29.0%
Year ended 31 March 2009
Revenue 1,778 3,723 5,501
Service revenue 1,548 3,565 5,113
EBITDA 606 1,114 1,720
Adjusted operating profit 373 302 675
EBITDA margin 34.1% 29.9% 31.3%
Notes:
(1) The Group revised how it determines and discloses segmental EBITDA and adjusted operating
profit during the year. See note 3 to the consolidated financial statements.
(2) Organic growth includes Vodacom (except the results of Gateway) at the current level of
ownership. See “Acquisitions” on page 42 for further details.
Revenue increased by 45.9% benefiting from the treatment of Vodacom as a
subsidiary and the full consolidation of its results from 18 May 2009 combined with
a significant benefit from foreign exchange rate movements. On an organic basis
service revenue declined by 1.2%(*), as the strong growth in Vodacom was offset by
a challenging economic environment across Central Europe, mobile termination rate
cuts and competition led pricing movements in Romania.
EBITDA increased by 35.3%, also benefiting from the full consolidation of Vodacom
and positive foreign exchange rate movements. On an organic basis EBITDA
decreased by 5.8%(*), with EBITDA margin decreasing due to turnaround investment
in Turkey and Ghana and increased competition and the difficult economic
environments across the region.
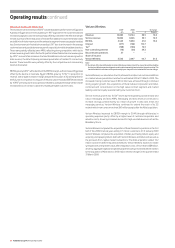
Organic M&A Foreign Reported
change activity exchange change
%pps pps %
Revenue
Africa and Central Europe (2.1) 38.9 9.1 45.9
Service revenue
Vodacom 4.6 112. 0 38.8 155.4
Other (7.0) 2.8 1.0 (3.2)
Africa and Central Europe (1.2) 37.6 8.4 44.8
EBITDA
Vodacom 10.4 101.8 39.9 152.1
Other (25.9) (4.1) 1.7 (28.3)
Africa and Central Europe (5.8) 30.8 10.3 35.3
Adjusted operating profit
Vodacom 12.5 3.1 23.8 39.4
Other (65.0) (32.9) 0.2 (97.7)
Africa and Central Europe (7.9) (23.3) 9.3 (21.9)
Vodacom
Service revenue grew by 4.6%(*) driven by a robust performance in South Africa offset
by revenue declines in Tanzania and the Democratic Republic of Congo. Data revenue
increased by 32.9%(*) driven by increased penetration of mobile broadband and
higher mobile internet usage. The introduction of prepaid customer registration in
South Africa negatively impacted customer growth in the year and mobile
termination rate reductions are expected to reduce growth in the 2011 financial year,
with the first reduction taking effect from 1 March 2010.
EBITDA increased by 10.4%(*) driven by the increase in service revenue and lower
direct costs and regulatory fees in South Africa.