Vodafone 2010 Annual Report Download - page 36
Download and view the complete annual report
Please find page 36 of the 2010 Vodafone annual report below. You can navigate through the pages in the report by either clicking on the pages listed below, or by using the keyword search tool below to find specific information within the annual report.-
 1
1 -
2
-
3
-
4
-
5
-
6
-
7
-
8
-
9
-
10
-
11
-
12
-
13
-
14
-
15
-
16
-
17
-
18
-
19
-
20
-
21
-
22
-
23
-
24
-
25
-
 26
26 -
 27
27 -
 28
28 -
 29
29 -
 30
30 -
 31
31 -
 32
32 -
 33
33 -
 34
34 -
 35
35 -
 36
36 -
 37
37 -
 38
38 -
 39
39 -
 40
40 -
 41
41 -
 42
42 -
 43
43 -
 44
44 -
 45
45 -
 46
46 -
47
-
48
-
49
-
50
-
51
-
52
-
53
-
54
-
55
-
56
-
57
-
58
-
59
-
60
-
61
-
62
-
63
-
64
-
65
-
66
-
67
-
68
-
69
-
70
-
71
-
72
-
73
-
74
-
75
-
76
-
77
-
78
-
79
-
80
-
81
-
82
-
83
-
84
-
85
-
86
-
87
-
88
-
89
-
90
-
91
-
92
-
93
-
94
-
95
-
96
-
97
-
98
-
99
-
100
-
101
-
102
-
103
-
104
-
105
-
106
-
107
-
108
-
109
-
110
-
111
-
112
-
113
-
114
-
115
-
116
-
117
-
118
-
119
-
120
-
121
-
122
-
123
-
124
-
125
-
126
-
127
-
128
-
129
-
130
-
131
-
132
-
133
-
134
-
135
-
136
-
137
-
138
-
139
-
140
-
141
-
142
-
143
-
144
-
145
-
146
-
147
-
148
 |
 |

34 Vodafone Group Plc Annual Report 2010
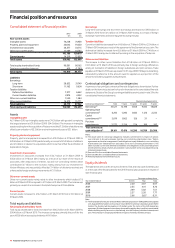
Operating results continued
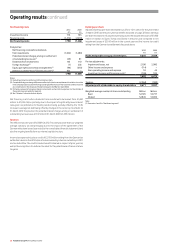
EBITDA decreased by 9.2%(*) as the decline in service revenue and the dilutive effect
of the increased contribution of lower margin fixed line services outweighed benefits
from cost cutting initiatives in customer and operating costs.
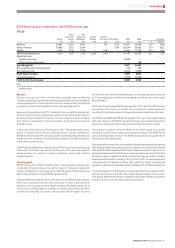
UK
Service revenue declined by 1.1%(*) primarily due to a decrease in voice revenue
resulting from increased competition in a challenging economic environment,
customer optimisation of out of bundle offers and lower roaming revenue. Wholesale
revenue increased due to the success of the MVNO business, principally ASDA and
Lebara. Data revenue growth was maintained, driven primarily by increased
penetration of mobile PC connectivity and mobile internet services. The acquisition
of Central Telecom, which provides converged enterprise services, was completed in
December 2008.
The 12.8%(*) decline in EBITDA , which included the impact of a £30 million VAT refund
in the 2008 financial year, was primarily due to higher off network usage in messaging
services and higher retention costs. The cost of retaining customers increased as a
higher proportion of the contract base received upgrades in the 2009 financial year
following the expiration of 18 month contracts which were introduced in 2006.
Operating expenses grew, primarily due to the impact of the sterling/euro exchange
rate on euro denominated intercompany charges; otherwise operating expenses
were broadly stable year-on-year.
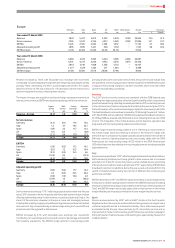
Other Europe
Service revenue decreased by 1.2%(*) during the year and 5.0%(*) in the fourth quarter,
as growth in the Netherlands was more than offset by declines in Greece and Ireland,
where the trends have deteriorated throughout the year. The Netherlands benefited
from a rise in the customer base and strong growth in visitor revenue. Both Greece
and Ireland were impacted by deteriorating market environments, which worsened
in the fourth quarter, and substantial price reductions in prepaid tariffs, whilst Greece
was also affected by termination rate cuts.
The fall in EBITDA margin of 1.2 percentage points was primarily driven by the
service revenue decline and restructuring charges recorded in the fourth quarter in
most countries.
The share of profit in SFR increased, reflecting the acquisition of Neuf Cegetel and
foreign exchange benefits on translation of the results into sterling.
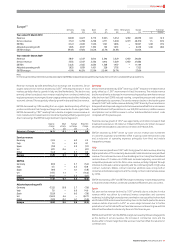
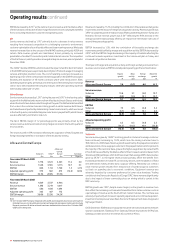
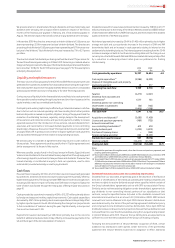
Africa and Central Europe
Africa and
Central
Vodacom Other(1) Europe % change
£m £m £m £Organic
Year ended 31 March 2009
Revenue 1,778 3,723 5,501 11.2 3.9
Service revenue 1,548 3,565 5,113 10.7 3.1
EBITDA 606 1,114 1,720 1.5 (2.3)
Adjusted operating profit 373 302 675 (12.6) (12.6)
EBITDA margin 34.1% 29.9% 31.3%
Year ended 31 March 2008
Revenue 1,609 3,337 4,946
Service revenue 1,398 3,219 4,617
EBITDA 586 1,108 1,694
Adjusted operating profit 365 407 772
EBITDA margin 36.4% 33.2% 34.2%
Note:
(1) On 1 October 2007 Romania rebased all of its tariffs and changed its functional currency from
US dollars to euros. In calculating all constant exchange rate and organic metrics which include
Romania, previous US dollar amounts have been translated into euros at the 1 October 2007
US$/euro exchange rate.
Revenue increased by 11.2%, including the contribution of favourable exchange rate
movements and the impact of merger and acquisition activity. Revenue growth was
3.9%(*) as sustained growth in Vodacom was offset by weakening trends in Turkey and
Romania. Service revenue growth was 3.1%(*) reflecting the 9.9% increase in the
average customer base partially offset by an impact from termination rate cuts of
around three percentage points.
EBITDA increased by 1.5%, with the contribution of favourable exchange rate
movements partially offset by merger and acquisition activity. EBITDA decreased by
2.3%(*), with the EBITDA margin decreasing in the majority of markets reflecting the
continued network expansion, investment in the turnaround plan in Turkey and
increased competition in Romania.
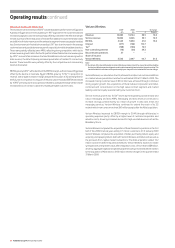
The impact of merger and acquisition activity and foreign exchange movements on
revenue, service revenue, EBITDA and adjusted operating profit are shown below:
Organic M&A Foreign Reported
growth activity exchange growth
%pps pps %
Revenue
Africa and Central Europe 3.9 (0.7) 8.0 11.2
Service revenue
Vodacom 13.8 2.1 (5.2) 10.7
Other (0.9) (1.5) 13.1 10.7
Africa and Central Europe 3.1 (0.6) 8.2 10.7
EBITDA
Vodacom 7.3 0.5 (4.4) 3.4
Other (6.7) (5.9) 13.1 0.5
Africa and Central Europe (2.3) (4.0) 7.8 1.5
Adjusted operating profit
Vodacom 6.3 0.3 (4.4) 2.2
Other (26.2) (10.5) 10.9 (25.8)
Africa and Central Europe (12.6) (5.6) 5.6 (12.6)
Vodacom
Service revenue grew by 13.8%(*) as strong growth in Vodacom’s average customer
base continued, increasing by 11.2%, which took the closing customer base to
39.6 million on a 100% basis. Revenue growth was driven by the prepaid voice market
and data services. Voice usage per customer in the prepaid market, which represents
the majority of the customer base, grew as the higher usage driven by revised tariffs
in South Africa was offset by the dilutive effect of the increased customer base in both
Tanzania and Mozambique, which both have lower than average ARPU. Data revenue
grew by 59.7%(*), as the higher revenue base partially offset the benefit from
increased penetration of mobile PC connectivity devices, with the absence of fixed
line alternatives making mobile data a popular offering. Relatively low contract
voice revenue growth resulted from reduced out of bundle usage as customers
cut back on spending due to economic conditions. Equipment revenue was
adversely impacted by consumer preference for lower value handsets. Trading
conditions in the Democratic Republic of Congo (‘DRC’) have worsened significantly
due to the impact of lower commodity prices on mining which is central to the
DRC’s economy.
EBITDA growth was 7.3%(*), despite lower margins, as the growth in revenue more
than offset the increasing cost base which benefited from stable customer costs as
a percentage of revenue as the South African market matures. The cost base was
adversely impacted by an increase in operating expenses due to continued expansion,
investment in enterprise services, Black Economic Empowerment share charges and
high wage inflation.
On 30 December 2008 Vodacom acquired the carrier services and business network
solutions subsidiaries (‘Gateway’) from Gateway Telecommunications SA (Pty) Ltd.
Gateway provides services in more than 40 countries in Africa.