Vodafone 2010 Annual Report Download - page 63
Download and view the complete annual report
Please find page 63 of the 2010 Vodafone annual report below. You can navigate through the pages in the report by either clicking on the pages listed below, or by using the keyword search tool below to find specific information within the annual report.-
 1
1 -
2
-
3
-
4
-
5
-
6
-
7
-
8
-
9
-
10
-
11
-
12
-
13
-
14
-
15
-
16
-
17
-
18
-
19
-
20
-
21
-
22
-
23
-
24
-
25
-
26
-
27
-
28
-
29
-
30
-
31
-
32
-
33
-
34
-
35
-
36
-
37
-
38
-
39
-
40
-
41
-
42
-
43
-
44
-
45
-
46
-
47
-
48
-
49
-
50
-
51
-
52
-
 53
53 -
 54
54 -
 55
55 -
 56
56 -
 57
57 -
 58
58 -
 59
59 -
 60
60 -
 61
61 -
 62
62 -
 63
63 -
 64
64 -
 65
65 -
 66
66 -
 67
67 -
 68
68 -
 69
69 -
 70
70 -
 71
71 -
 72
72 -
 73
73 -
74
-
75
-
76
-
77
-
78
-
79
-
80
-
81
-
82
-
83
-
84
-
85
-
86
-
87
-
88
-
89
-
90
-
91
-
92
-
93
-
94
-
95
-
96
-
97
-
98
-
99
-
100
-
101
-
102
-
103
-
104
-
105
-
106
-
107
-
108
-
109
-
110
-
111
-
112
-
113
-
114
-
115
-
116
-
117
-
118
-
119
-
120
-
121
-
122
-
123
-
124
-
125
-
126
-
127
-
128
-
129
-
130
-
131
-
132
-
133
-
134
-
135
-
136
-
137
-
138
-
139
-
140
-
141
-
142
-
143
-
144
-
145
-
146
-
147
-
148
 |
 |

Governance
Vodafone Group Plc Annual Report 2010 61
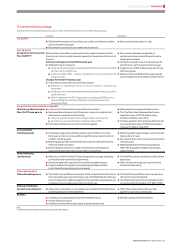
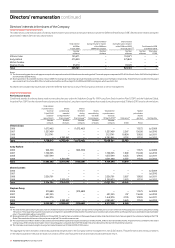
Awards made to executive directors during the 2010 nancial year
Reward elements Vittorio Colao Andy Halford Michel Combes Stephen Pusey
Base salary Vittorio’s base salary was not
increased from £975,000 in
July 2009.
Andy’s base salary was not
increased from £674,100 in July
2009.
Michel’s base salary increased
from £720,000 to £740,000 on
1 June 2009 on promotion to
the Board.
Stephen’s base salary increased
from £445,200 to £500,000 on
1 June 2009 on promotion to
the Board.
Annual bonus The target bonus was £975,000
and the maximum bonus was
£1,950,000.
The target bonus was £674,100
and the maximum bonus was
£1,348,200.
The target bonus was £736,667
and the maximum bonus was
£1,473,334.
The target bonus was £490,867
and the maximum bonus was
£981,734.
Long-term incentive plan In June 2009 the base award
for the Chief Executive had
a face value of 137.5% of base
salary at target.
In July 2009 the base award for
the Chief Financial Officer had
a face value of 110% of base
salary at target.
In June 2009 the base award
for the Chief Executive, Europe
had a face value of 110% of
base salary at target.
In June 2009 the base award for
the Chief Technology Officer
had a face value of 110% of base
salary at target.
Investment opportunity Vittorio invested 55% of the
maximum into the GLTI plan
(529,098 shares) and therefore
received a matching award
with a face value of 55% base
salary at target.
Andy invested 73% of the
maximum into the GLTI plan
(486,146 shares) and therefore
received a matching award
with a face value of 73%
base salary at target.
Michel invested 21% of the
maximum into the GLTI plan
(156,014) shares and therefore
received a matching award
with a face value of 21%
base salary at target.
Stephen invested 30% of the
maximum into the GLTI plan
(147,896 shares) and therefore
received a matching award
with a face value of 30% base
salary at target.
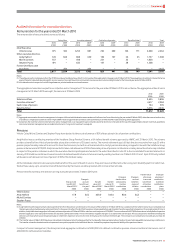
Amounts executive directors will actually receive in the 2011 nancial year
As previously explained a very large percentage of the executive directors’ package is made up of variable pay subject to performance. The information below explains
what the executive directors who were on the Board on 31 March 2010 will actually receive from awards made previously with performance conditions which ended on
31 March 2010 but that will vest in the 2011 financial year.
As previously noted there were no salary increases, other than for promotions, for the executive directors during the 2010 financial year. However the Remuneration
Committee felt that it was appropriate to review base salary levels for the 2011 financial year. Accordingly, the new salaries shown below will become effective 1 July 2010.
In the case of Vittorio Colao this is his first increase since his promotion to the role of Chief Executive two years ago and reflects his outstanding leadership of the Company
in a very difficult environment.
The executive directors 2009/10 GSTIP is payable in June 2010 with actual payments detailed in the table below. Vittorio Colao, Andy Halford and Stephen Pusey were
measured solely against Group performance, whilst Michel Combes was measured on both Group and Europe Region performance. Group performance was at or above
target for each of the key financial measures particularly with respect to free cash flow.
Later in 2010 the GLTI share options granted in 2007 will vest. The threshold relative TSR performance target for the 2007 GLTI performance shares was met and, as such,
shares will vest from this award at 25%. In all cases performance was determined at 31 March 2010 year end. These figures are set out in the table below (only the 2009/10
GSTIP payment is included in the audited section towards the end of the directors’ remuneration report).
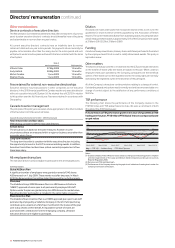
Vittorio Colao Andy Halford Michel Combes Stephen Pusey
Base salary
Base salary effective from July 2010 £1,065,000 £700,000 £770,000 £550,000
GSTIP (Annual bonus)(1)
Target (100% of base salary earned over 2010) £975,000 £674,100 £736,667 £490,867
Percentage of target achieved for the 2010 financial year 128.7% 128.7% 111.0% 128.7%
Actual bonus payout in June 2010 £1,254,825 £867,567 £817,700 £631,746
GLTI share options
Exercise price 162.5p 162.5p –162.5p
GLTI share options awarded in July 2007 3,003,575 2,295,589 –947, 556
Vesting percentage based on three year earnings per share (‘EPS’) growth 100% 100% –100%
GLTI share options vesting in 2010 3,003,575 2,295,589 – 947,556
GLTI performance shares
GLTI performance share awarded in July 2007 1,557,409 1,190,305 –491,325
Vesting percentage based on relative TSR 25% 25% –25%
GLTI performance shares vesting in 2010 389,352 297,576 – 122,831
Note:
(1) More information on key performance indicators, against which Group performance is measured, can be found in “Key performance indicators” on page 24.