Vodafone 2010 Annual Report Download - page 106
Download and view the complete annual report
Please find page 106 of the 2010 Vodafone annual report below. You can navigate through the pages in the report by either clicking on the pages listed below, or by using the keyword search tool below to find specific information within the annual report.-
 1
1 -
2
-
3
-
4
-
5
-
6
-
7
-
8
-
9
-
10
-
11
-
12
-
13
-
14
-
15
-
16
-
17
-
18
-
19
-
20
-
21
-
22
-
23
-
24
-
25
-
26
-
27
-
28
-
29
-
30
-
31
-
32
-
33
-
34
-
35
-
36
-
37
-
38
-
39
-
40
-
41
-
42
-
43
-
44
-
45
-
46
-
47
-
48
-
49
-
50
-
51
-
52
-
53
-
54
-
55
-
56
-
57
-
58
-
59
-
60
-
61
-
62
-
63
-
64
-
65
-
66
-
67
-
68
-
69
-
70
-
71
-
72
-
73
-
74
-
75
-
76
-
77
-
78
-
79
-
80
-
81
-
82
-
83
-
84
-
85
-
86
-
87
-
88
-
89
-
90
-
91
-
92
-
93
-
94
-
95
-
 96
96 -
 97
97 -
 98
98 -
 99
99 -
 100
100 -
 101
101 -
 102
102 -
 103
103 -
 104
104 -
 105
105 -
 106
106 -
 107
107 -
 108
108 -
 109
109 -
 110
110 -
 111
111 -
 112
112 -
 113
113 -
 114
114 -
 115
115 -
 116
116 -
117
-
118
-
119
-
120
-
121
-
122
-
123
-
124
-
125
-
126
-
127
-
128
-
129
-
130
-
131
-
132
-
133
-
134
-
135
-
136
-
137
-
138
-
139
-
140
-
141
-
142
-
143
-
144
-
145
-
146
-
147
-
148
 |
 |

104 Vodafone Group Plc Annual Report 2010
Notes to the consolidated nancial statements continued
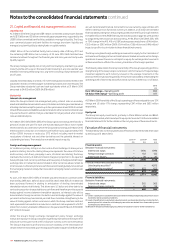
21. Capital and nancial risk management continued
Liquidity risk
At 31 March 2010 the Group had US$9.1 billion committed undrawn bank facilities
and US$15 billion and £5 billion commercial paper programmes, supported by the
US$9.1 billion committed bank facilities, available to manage its liquidity. The Group
uses commercial paper and bank facilities to manage short-term liquidity and
manages long-term liquidity by raising funds on capital markets.
US$4.1 billion of the committed facility has a maturity date of 28 July 2011 and
the remaining US$5 billion has a maturity of 22 June 2012. Both facilities have
remained undrawn throughout the financial year and since year end and provide
liquidity support.
The Group manages liquidity risk on long-term borrowings by maintaining a varied
maturity profile with a cap on the level of debt maturing in any one calendar year,
therefore minimising refinancing risk. Long-term borrowings mature between one
and 27 years.
Liquidity is reviewed daily on at least a 12 month rolling basis and stress tested on the
assumption that all commercial paper outstanding matures and is not reissued. The
Group maintains substantial cash and cash equivalents which at 31 March 2010
amounted to £4,423 million (2009: £4,878 million).
Market risk
Interest rate management
Under the Group’s interest rate management policy, interest rates on monetary
assets and liabilities denominated in euros, US dollars and sterling are maintained on
a floating rate basis except for periods up to four years when at least 20% of net debt
is fixed. Where assets and liabilities are denominated in other currencies interest rates
may also be fixed. In addition, fixing is undertaken for longer periods when interest
rates are statistically low.
At 31 March 2010 36% (2009: 43%) of the Group’s gross borrowings were fixed for a
period of at least one year. For each one hundred basis point fall or rise in market
interest rates for all currencies in which the Group had borrowings at 31 March 2010
there would be a reduction or increase in profit before tax by approximately £165
million (2009: increase or reduce by £175 million) including mark-to-market
revaluations of interest rate and other derivatives and the potential interest on
outstanding tax issues. There would be no material impact on equity.
Foreign exchange management
As Vodafone’s primary listing is on the London Stock Exchange its share price is
quoted in sterling. Since the sterling share price represents the value of its future
multi-currency cash flows, principally in euro, US dollars and sterling, the Group
maintains the currency of debt and interest charges in proportion to its expected
future principal multi-currency cash flows and has a policy to hedge external foreign
exchange risks on transactions denominated in other currencies above certain de
minimis levels. As the Group’s future cash flows are increasingly likely to be derived
from emerging markets it is likely that more debt in emerging market currencies will
be drawn.
As such, at 31 March 2010 120% of net debt was denominated in currencies other
than sterling (49% euro, 46% US dollar and 25% other) while 20% of net debt had
been purchased forward in sterling in anticipation of sterling denominated
shareholder returns via dividends. This allows euro, US dollar and other debt to be
serviced in proportion to expected future cash flows and therefore provides a partial
hedge against income statement translation exposure, as interest costs will be
denominated in foreign currencies. Yen debt is used as a hedge against the value of
yen assets as the Group has minimal yen cash flows. A relative strengthening in the
value of sterling against certain currencies in which the Group maintains cash and
cash equivalents has resulted in a reduction in cash and cash equivalents of £257
million from currency translation differences in the year ended 31 March 2010 (2009:
£371 million increase).
Under the Group’s foreign exchange management policy foreign exchange
transaction exposure in Group companies is generally maintained at the lower of €5
million per currency per month or €15 million per currency over a six month period.
The Group is exposed to profit and loss account volatility on the retranslation of
certain investments received upon the disposal of Vodafone Japan to SoftBank which
are yen denominated financial instruments but are owned by legal entities with
either a sterling or euro functional currency. In addition, a US dollar denominated
financial liability arising from the put rights granted over the Essar Group’s interests
in Vodafone Essar in the 2008 financial year and discussed on page 44, were granted
by a legal entity with a euro functional currency. A 19%, 8% or 12% (2009: 23%, 10%
or 15%) change in the ¥/£, ¥/€ or US$/€ exchange rates would have a £146 million,
£122 million or £393 million (2009: £164 million, £136 million and £496 million)
impact on profit or loss in relation to these financial instruments.
The Group recognises foreign exchange movements in equity for the translation of
net investment hedging instruments and balances treated as investments in foreign
operations. However there is no net impact on equity for exchange rate movements
as there would be an offset in the currency translation of the foreign operation.
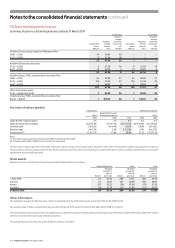
The following table details the Group’s sensitivity of the Group’s operating profit to a
strengthening of the Group’s major currencies in which it transacts. The percentage
movement applied to each currency is based on the average movements in the
previous three annual reporting periods. Amounts are calculated by retranslating the
operating profit of each entity whose functional currency is either euro or US dollar.
2010
£m
Euro 12% change – Operating profit 804
US dollar 15% change – Operating profit 617
At 31 March 2009 sensitivity of the Group’s operating profit was analysed for euro 12%
change and US dollar 17% change, representing £347 million and £632 million
respectively.
Equity risk
The Group has equity investments, primarily in China Mobile Limited and Bharti
Infotel Private Limited, w hich are subject to equit y risk . See note 15 to th e consolidated
financial statements for further details on the carrying value of these investments.
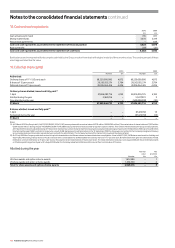
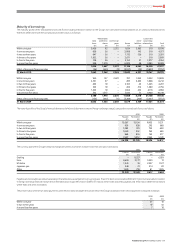
Fair value of nancial instruments
The table below sets out the valuation basis of financial instruments held at fair value
by the Group at 31 March 2010.
Level 1(1) Level 2(2) Total
£ m £ m £ m
Financial assets:
Derivative financial instruments:
Interest rate swaps – 1,996 1,996
Foreign exchange contracts – 132 132
Interest rate futures – 20 20
– 2,148 2,148
Financial investments available-for-sale:
Listed equity securities(3) 4,072 – 4,072
Unlisted equity securities(3) – 623 623
4,072 623 4,695
4,072 2,771 6,843
Financial liabilities:
Derivative financial instruments:
Interest rate swaps – 365 365
Foreign exchange contracts – 95 95
– 460 460
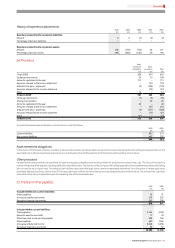
Notes:
(1) Level 1 classif icat ion is used w her e fair value i s deter mi ne d by unadjusted quoted prices in a cti ve
markets for identical assets or liabilities.
(2) Level 2 classification is used where valuation inputs are observable directly or indirectly from
quoted prices. Fair values for unlisted equity securities are derived from observable quoted
market prices for similar items.
(3) Details of listed and unlisted equity securities are included in note 15 “Other Investments”.