Vodafone 2010 Annual Report Download - page 34
Download and view the complete annual report
Please find page 34 of the 2010 Vodafone annual report below. You can navigate through the pages in the report by either clicking on the pages listed below, or by using the keyword search tool below to find specific information within the annual report.-
 1
1 -
2
-
3
-
4
-
5
-
6
-
7
-
8
-
9
-
10
-
11
-
12
-
13
-
14
-
15
-
16
-
17
-
18
-
19
-
20
-
21
-
22
-
23
-
 24
24 -
 25
25 -
 26
26 -
 27
27 -
 28
28 -
 29
29 -
 30
30 -
 31
31 -
 32
32 -
 33
33 -
 34
34 -
 35
35 -
 36
36 -
 37
37 -
 38
38 -
 39
39 -
 40
40 -
 41
41 -
 42
42 -
 43
43 -
 44
44 -
45
-
46
-
47
-
48
-
49
-
50
-
51
-
52
-
53
-
54
-
55
-
56
-
57
-
58
-
59
-
60
-
61
-
62
-
63
-
64
-
65
-
66
-
67
-
68
-
69
-
70
-
71
-
72
-
73
-
74
-
75
-
76
-
77
-
78
-
79
-
80
-
81
-
82
-
83
-
84
-
85
-
86
-
87
-
88
-
89
-
90
-
91
-
92
-
93
-
94
-
95
-
96
-
97
-
98
-
99
-
100
-
101
-
102
-
103
-
104
-
105
-
106
-
107
-
108
-
109
-
110
-
111
-
112
-
113
-
114
-
115
-
116
-
117
-
118
-
119
-
120
-
121
-
122
-
123
-
124
-
125
-
126
-
127
-
128
-
129
-
130
-
131
-
132
-
133
-
134
-
135
-
136
-
137
-
138
-
139
-
140
-
141
-
142
-
143
-
144
-
145
-
146
-
147
-
148
 |
 |

32 Vodafone Group Plc Annual Report 2010
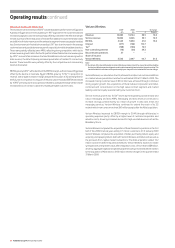
Operating results continued
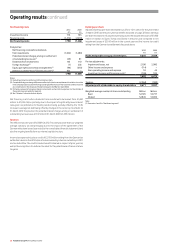
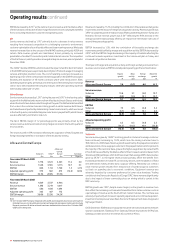
Net financing costs
2009 2008
£m £m
Investment income 795 714
Financing costs (2,419) (2,014)
Net financing costs (1,624) (1,300)
Analysed as:
Net financing costs before dividend
from investments (1,480) (823)
Potential interest charges arising on settlement
of outstanding tax issues(1) 81 (399)
Dividends from investments 110 72
Foreign exchange(2) 235 (7)
Equity put rights and similar arrangements(3) (570) (143)
(1,624) (1,300)
Notes:
(1) Includes release of a £317 million interest accrual relating to a favourable settlement of long
standing tax issues. See “Taxation” below.
(2) Comprises foreign exchange differences reflected in the income statement in relation to certain
intercompany balances and the foreign exchange differences on financial instruments received
as consideration in the disposal of Vodafone Japan to SoftBank in April 2006.
(3) Primarily represents foreign exchange movements and accretion expense. The amount for the
year ended 31 March 2008 also includes a charge of £333 million representing the initial fair
value of the put options granted over the Essar Group’s interest in Vodafone Essar, which was
recorded as an expense. Further details of these options are provided on page 44.
Net financing costs before dividends from investments increased by 79.8% to
£1,480 million, primarily due to mark-to-market losses in the 2009 financial year
compared with gains in the 2008 financial year and unfavourable exchange rate
movements impacting the translation into sterling. The interest charge resulting
from the 28.2% increase in average net debt was minimised due to changes in the
currency mix of debt and significantly lower interest rates for US dollar and euro
denominated debt. At 31 March 2009 the provision for potential interest charges
arising on settlement of outstanding tax issues was £1,635 million (31 March 2008:
£1,577 million).
Taxation
The effective tax rate was 26.5% (2008: 24.9%). This rate was lower than our weighted
average statutory tax rate due to the structural benefit from the ongoing
enhancement to our internal capital structure and a benefit of £767 million following
the resolution of long standing tax issues related to the acquisition and subsequent
restructuring of the Mannesmann Group. This was offset by an increase in the rate
due to the impact of impairment losses for which no tax benefit is recorded.
Earnings per share
Adjusted earnings per share increased by 37.4% to 17.17 pence for the year ended
31 March 2009, resulting primarily from movements in exchange rates and the
benefit from a favourable tax settlement, as discussed to the left. Excluding these
factors, adjusted earnings per share rose by around 3%. Basic earnings per share
decreased by 53.5% to 5.84 pence including the impairment losses of £5.9 billion.
2009 2008
£m £m
Profit from continuing operations
attributable to equity shareholders 3,078 6,660
Adjustments:
Impairment losses 5,900 –
Other income and expense(1) –28
Non-operating income and expense(2) 44 (254)
Investment income and financing costs(3) 335 150
6,279 (76)
Foreign exchange on tax balances (155) –
Tax on the above items (145) 44
Adjusted profit attributable to equity shareholders 9,057 6,628
Weighted average number of shares outstanding Million Million
Basic 52,737 53,019
Diluted 52,969 53,287
Notes:
(1) The amount for the 2008 financial year represents a pre-tax charge offsetting the tax benefit
arising on recognition of a pre-acquisition deferred tax asset.
(2) The amount for the 2009 financial year includes a £39 million adjustment in relation to the broad
based black economic empowerment transaction undertaken by Vodacom. The amount for the
2008 f ina ncial year includes £250 mi llion rep resenting the prof it on disposal of our 5.60% direct
investment in Bharti Airtel Limited (‘Bharti Airtel’).
(3) See notes 2 and 3 in “Net financing costs”.