Vodafone 2010 Annual Report Download - page 9
Download and view the complete annual report
Please find page 9 of the 2010 Vodafone annual report below. You can navigate through the pages in the report by either clicking on the pages listed below, or by using the keyword search tool below to find specific information within the annual report.-
 1
1 -
 2
2 -
 3
3 -
 4
4 -
 5
5 -
 6
6 -
 7
7 -
 8
8 -
 9
9 -
 10
10 -
 11
11 -
 12
12 -
 13
13 -
 14
14 -
 15
15 -
 16
16 -
 17
17 -
 18
18 -
 19
19 -
 20
20 -
21
-
22
-
23
-
24
-
25
-
26
-
27
-
28
-
29
-
30
-
31
-
32
-
33
-
34
-
35
-
36
-
37
-
38
-
39
-
40
-
41
-
42
-
43
-
44
-
45
-
46
-
47
-
48
-
49
-
50
-
51
-
52
-
53
-
54
-
55
-
56
-
57
-
58
-
59
-
60
-
61
-
62
-
63
-
64
-
65
-
66
-
67
-
68
-
69
-
70
-
71
-
72
-
73
-
74
-
75
-
76
-
77
-
78
-
79
-
80
-
81
-
82
-
83
-
84
-
85
-
86
-
87
-
88
-
89
-
90
-
91
-
92
-
93
-
94
-
95
-
96
-
97
-
98
-
99
-
100
-
101
-
102
-
103
-
104
-
105
-
106
-
107
-
108
-
109
-
110
-
111
-
112
-
113
-
114
-
115
-
116
-
117
-
118
-
119
-
120
-
121
-
122
-
123
-
124
-
125
-
126
-
127
-
128
-
129
-
130
-
131
-
132
-
133
-
134
-
135
-
136
-
137
-
138
-
139
-
140
-
141
-
142
-
143
-
144
-
145
-
146
-
147
-
148
 |
 |

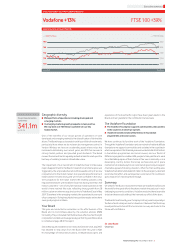
35.5
41.0 44.5
201020092008
Vodafone Group Plc Annual Report 2010 7
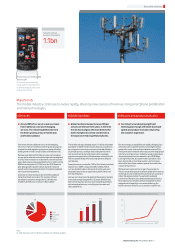
Towers, the world’s largest tower company with more than 100,000
towers under management. However the introduction of six additional
national mobile licences one year after our entry and the resulting
intense price competition have led to a £2.3 billion impairment charge.
In Australia our joint venture company with Hutchison continues to
perform in line with the merger plan with pro-forma revenue growth
of 8%. The EBITDA margin for the region declined by 2.2 percentage
points, primarily reflecting lower margins in India caused by the
competitive pricing environment and operating investment in
new circles.
Verizon Wireless posted another set of strong results for the financial
year. Ser vice revenue growth was 6.3%(*) driven by increased customer
penetration and data, although price competition has increased and
growth rates have slowed in the second half of the year. We have
established joint initiatives with Verizon Wireless around LTE
technology and enterprise customers during the year.
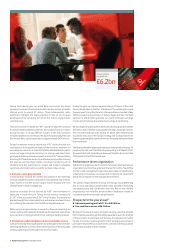
We maintained capital investment at a similar level to the previous
financial year and invested £6.2 billion, consistent with our guidance
in May 2009. Capital expenditure in Europe was slightly higher than in
the 2009 financial year as we took advantage of our strong cash
generation to accelerate investment in fixed and mobile broadband
networks, and in services to enterprise customers.
Adjusted earnings per share was 16.11 pence, lower than last year
primarily as the result of a one-off tax and associated interest benefit
in the prior year. Excluding this, adjusted earnings per share increased
by 6.6%.
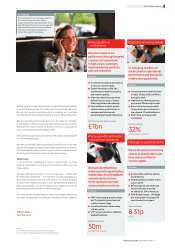
Total dividends per share have increased by 7% to 8.31 pence with a
final dividend of 5.65 pence per share, up 9% reflecting the strong cash
performance of the Group.
Strategy
Cost reduction targets delivered a year ahead of plan.
Strong revenue growth from data and fixed line services.
Continued strong growth in emerging markets.
Enhanced shareholder returns – new three year
dividend target.
Vodafone continues to evolve towards being a total communications
provider, rebalancing mobile voice in mature economies with
increasing revenue from broadband data services. We have also
increased the proportion of revenue we generate from emerging
economies. In parallel we continued to reduce our cost base to finance
growth and commercial competitiveness primarily by leveraging our
Group scale.
1. Drive operational performance
We have reinforced the commercial focus of our operating companies
by emphasising relative market share of quality customers , e xploitation
of the data opportunity and expansion into converged services.
Progress in all areas has become more evident in the second half of
the year.
At the same time we accelerated our £1 billion cost reduction
programme, announced in 2008, and delivered its full benefits one
year ahead of plan. The majority of these savings were generated by
our European operations and from cost reductions in our central
functions. Despite growth in mobile voice minutes and a significant
increase in data usage, Europe’s overheads declined enabling
commercial investment to be increased.
In November we announced a further £1 billion cost saving programme
to be delivered by the 2013 financial year. This will help us to
offset inflationary pressures and the competitive environment and
enable us to invest in our revenue growth opportunities. Around half
of these savings will be available for commercial reinvestment or
margin enhancement.
We will continually update our programme to identify further ways in
which the Group can benefit from its regional scale and further reduce
costs in order to offset external pressures and competitor action and
to invest in growth.
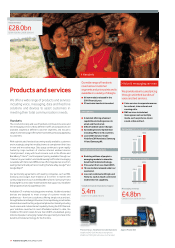
2. Pursue growth opportunities in total communications
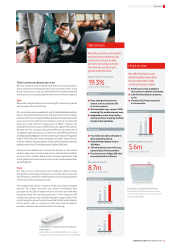
Data revenue grew by 19.3%(*) and is now over £4 billion. In addition to
driving continued growth in PC connectivity services, we have been
particularly successful in increasing smartphone penetration across
our customer base and in ensuring that smartphone customers
subscribed for additional data services.
Revenue (£bn)
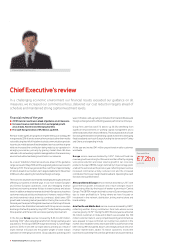
Executive summary
“ We have improved
our commercial
focus and cost
efciency, with
visible results.”