Vodafone 2010 Annual Report Download - page 92
Download and view the complete annual report
Please find page 92 of the 2010 Vodafone annual report below. You can navigate through the pages in the report by either clicking on the pages listed below, or by using the keyword search tool below to find specific information within the annual report.-
 1
1 -
2
-
3
-
4
-
5
-
6
-
7
-
8
-
9
-
10
-
11
-
12
-
13
-
14
-
15
-
16
-
17
-
18
-
19
-
20
-
21
-
22
-
23
-
24
-
25
-
26
-
27
-
28
-
29
-
30
-
31
-
32
-
33
-
34
-
35
-
36
-
37
-
38
-
39
-
40
-
41
-
42
-
43
-
44
-
45
-
46
-
47
-
48
-
49
-
50
-
51
-
52
-
53
-
54
-
55
-
56
-
57
-
58
-
59
-
60
-
61
-
62
-
63
-
64
-
65
-
66
-
67
-
68
-
69
-
70
-
71
-
72
-
73
-
74
-
75
-
76
-
77
-
78
-
79
-
80
-
81
-
 82
82 -
 83
83 -
 84
84 -
 85
85 -
 86
86 -
 87
87 -
 88
88 -
 89
89 -
 90
90 -
 91
91 -
 92
92 -
 93
93 -
 94
94 -
 95
95 -
 96
96 -
 97
97 -
 98
98 -
 99
99 -
 100
100 -
 101
101 -
 102
102 -
103
-
104
-
105
-
106
-
107
-
108
-
109
-
110
-
111
-
112
-
113
-
114
-
115
-
116
-
117
-
118
-
119
-
120
-
121
-
122
-
123
-
124
-
125
-
126
-
127
-
128
-
129
-
130
-
131
-
132
-
133
-
134
-
135
-
136
-
137
-
138
-
139
-
140
-
141
-
142
-
143
-
144
-
145
-
146
-
147
-
148
 |
 |

90 Vodafone Group Plc Annual Report 2010
Notes to the consolidated nancial statements continued
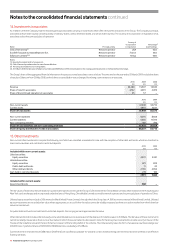
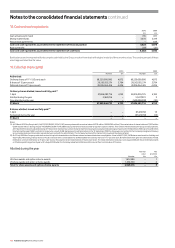
6. Taxation continued
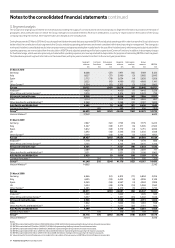
At 31 March 2010 the gross amount and expiry dates of losses available for carry forward are as follows:
Expiring Expiring
within within
5 years 6-10 years Unlimited Total
£m £m £m £m
Losses for which a deferred tax asset is recognised 12 –4,070 4,082
Losses for which no deferred tax asset is recognised 1,820 57 100,396 102,273
1,832 57 104,466 106,355
Included above are losses amounting to £1,909 million (2009: £1,940 million) in respect of UK subsidiaries which are only available for offset against future capital gains and
since it is uncertain whether these losses will be utilised, no deferred tax asset has been recognised.
The losses above also include £83,168 million (2009: £77,780 million) that have arisen in overseas holding companies as a result of revaluations of those companies’
investments for local GAAP purposes. Since it is uncertain whether these losses will be utilised, no deferred tax asset has been recognised.
During the year the German tax authorities decided to allow £13,513 million of a potential £46,716 million of losses arising on the write down of investments in Germany
(see “Taxation” on page 26). These losses are available to use against both federal and trade tax liabilities in Germany. Losses of £3,922 million (£1,747 million for federal tax
and £2,175 million for trade tax) are included in the above table on which the Group has recognised a deferred tax asset. The Group has not recognised a deferred tax asset
on £14,544 million (£9,391 million for federal tax and £5,153 million for trade tax) of the losses as it is uncertain that these losses will be utilised.
The Group holds provisions in respect of deferred taxation that would arise if temporary differences on investments in subsidiaries, associates and interests in joint ventures
were to be realised after the year end reporting date. No deferred tax liability has been recognised in respect of a further £51,783 million (2009: £63,551 million) of unremitted
earnings of subsidiaries, associates and joint ventures because the Group is in a position to control the timing of the reversal of the temporary difference and it is probable
that such differences will not reverse in the foreseeable future. It is not practicable to estimate the amount of unrecognised deferred tax liabilities in respect of these
unremitted earnings.
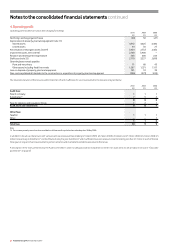
7. Equity dividends
2010 2009 2008
£m £m £m
Declared during the financial year:
Final dividend for the year ended 31 March 2009: 5.20 pence per share
(2008: 5.02 pence per share, 2007: 4.41 pence per share) 2,731 2,667 2,331
Interim dividend for the year ended 31 March 2010: 2.66 pence per share
(2009: 2.57 pence per share, 2008: 2.49 pence per share) 1,400 1,350 1,322
4,131 4,017 3,653
Proposed after the end of the reporting period and not recognised as a liability:
Final dividend for the year ended 31 March 2010: 5.65 pence per share
(2009: 5.20 pence per share, 2008: 5.02 pence per share) 2,976 2,731 2,667
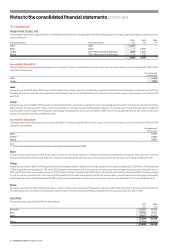
8. Earnings per share
2010 2009 2008
Millions Millions Millions
Weighted average number of shares for basic earnings per share 52,595 52,737 53,019
Effect of dilutive potential shares: restricted shares and share options 254 232 268
Weighted average number of shares for diluted earnings per share 52,849 52,969 53,287
£m £m £m
Earnings for basic and diluted earnings per share 8,645 3,078 6,660