Vodafone 2010 Annual Report Download - page 38
Download and view the complete annual report
Please find page 38 of the 2010 Vodafone annual report below. You can navigate through the pages in the report by either clicking on the pages listed below, or by using the keyword search tool below to find specific information within the annual report.-
 1
1 -
2
-
3
-
4
-
5
-
6
-
7
-
8
-
9
-
10
-
11
-
12
-
13
-
14
-
15
-
16
-
17
-
18
-
19
-
20
-
21
-
22
-
23
-
24
-
25
-
26
-
27
-
 28
28 -
 29
29 -
 30
30 -
 31
31 -
 32
32 -
 33
33 -
 34
34 -
 35
35 -
 36
36 -
 37
37 -
 38
38 -
 39
39 -
 40
40 -
 41
41 -
 42
42 -
 43
43 -
 44
44 -
 45
45 -
 46
46 -
 47
47 -
 48
48 -
49
-
50
-
51
-
52
-
53
-
54
-
55
-
56
-
57
-
58
-
59
-
60
-
61
-
62
-
63
-
64
-
65
-
66
-
67
-
68
-
69
-
70
-
71
-
72
-
73
-
74
-
75
-
76
-
77
-
78
-
79
-
80
-
81
-
82
-
83
-
84
-
85
-
86
-
87
-
88
-
89
-
90
-
91
-
92
-
93
-
94
-
95
-
96
-
97
-
98
-
99
-
100
-
101
-
102
-
103
-
104
-
105
-
106
-
107
-
108
-
109
-
110
-
111
-
112
-
113
-
114
-
115
-
116
-
117
-
118
-
119
-
120
-
121
-
122
-
123
-
124
-
125
-
126
-
127
-
128
-
129
-
130
-
131
-
132
-
133
-
134
-
135
-
136
-
137
-
138
-
139
-
140
-
141
-
142
-
143
-
144
-
145
-
146
-
147
-
148
 |
 |

36 Vodafone Group Plc Annual Report 2010
Operating results continued
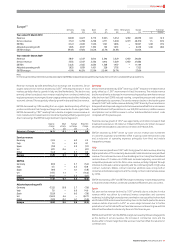
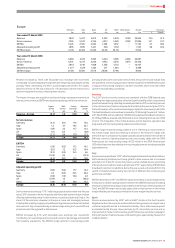
Other Asia Pacific and Middle East
The increase in service revenue of 8.5%(*) was attributable to performances in Egypt and
Australia. In Egypt ser vice revenue grew by 11.9%(*) as growth in the customer base and
increased usage per customer were partially offset by a decline in the effective rate per
minute as a result of the introduction of new tariffs in addition to lower termination rates
and a fall in both visitor revenue and the enterprise segment revenue as people travelled
less. Service revenue in Australia increased by 6.1%(*) due to an increase in the average
customer base and good data revenue grow th, especially in mobile broadband services.
These were partially offset by lower ARPU, reflecting strong competition, which led to
a lower revenue growth rate in the fourth quarter. In New Zealand service revenue grew
by 4.9%(*) as result of an increase in the fixed broadband customer base and growth in
data services, the latter following increased penetration of mobile PC connectivity
devices. These benefits were partially offset by the competitive and recessionary
trends in the market.
EBITDA grew by 6.9%(*), with a decline in the EBITDA margin, as the increase in Egypt was
offset by the decline in Australia. Egypt’s EBITDA grew by 15.5%(*) in proportion to
revenue, with a slight increase in margin, despite the inclusion of 3G licensing fees for
the full year in comparison to only part of the prior year. In Australia EBITDA decreased
by 16.9%(*) primarily due to a loss provision related to a prepaid recharge vendor and an
increased focus on contract customers resulting in higher customer costs.
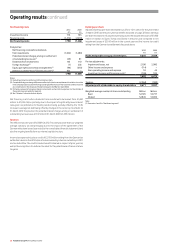
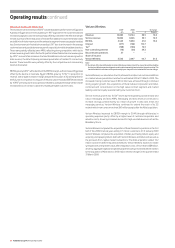
Verizon Wireless
2009 2008 % change
£m £m £Organic
Revenue 14,085 10,144 38.9 10.4
Service revenue 12,862 9,246 39.1 10.5
EBITDA 5,543 3,930 41.0 13.0
Interest (217) (102) 112.7
Tax(1) (198) (166) 19.3
Non-controlling interest (78) (56) 39.3
Discontinued operations 57 – –
Share of result in
Verizon Wireless 3,542 2,447 44.7 21.6
Note:
(1) Our share of the tax attributable to Verizon Wireless relates only to th e corporate ent ities he ld by
the Verizon Wireless par tnership and cer tain state taxes w hich are levied on th e partnership. The
tax attributable to our share of the partnership’s pre-tax profit is included within our tax charge.
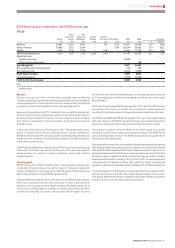
Verizon Wireless, our associate in the US, achieved 5.6 million net customer additions
in a market where penetration reached an estimated 92% at 31 March 2009. The
increased closing customer base of 86.6 million was achieved through continued
strong organic growth, the acquisitions of Rural Cellular Corporation and Alltel,
combined with concentration on the high value contract segment and market
leading customer loyalty as evidenced by low customer churn.
Service revenue growth was 10.5%(*) driven by the expanding customer base and
robust messaging and data ARPU. Messaging and data revenue continued to
increase strongly, predominantly as a result of growth in data card, email and
messaging services. Verizon Wireless continued to extend the reach of its 3G
network which now covers more than 280 million people after the Alltel acquisition.
Verizon Wireless improved its EBITDA margin to 39.4% through efficiencies in
operating expenses partly offset by a higher level of customer acquisition and
retention costs, driven by increased demand for high-end data devices such as the
BlackBerry Storm.
Verizon Wireless completed the acquisition of Rural Cellular Corporation in the first
half of the 2009 financial year, adding 0.7 million customers. On 9 January 2009
Verizon Wireless completed its acquisition of Alltel, purchasing Alltel’s equity and
acquiring and repaying Alltel’s debt with Verizon Wireless and Alltel cash as well as
the proceeds from capital market transactions. The Alltel acquisition added 13.2
million customers before required divestitures. Verizon Wireless expects to realise
synergies with a net present value, after integration costs, of more than US$9 billion,
driven by aggregate capital and operating expense savings. Increased debt in relation
to the acquisition of Alltel led to a £150 million interest charge for the quarter ended
31 March 2009.