Vodafone 2010 Annual Report Download - page 27
Download and view the complete annual report
Please find page 27 of the 2010 Vodafone annual report below. You can navigate through the pages in the report by either clicking on the pages listed below, or by using the keyword search tool below to find specific information within the annual report.-
 1
1 -
2
-
3
-
4
-
5
-
6
-
7
-
8
-
9
-
10
-
11
-
12
-
13
-
14
-
15
-
16
-
 17
17 -
 18
18 -
 19
19 -
 20
20 -
 21
21 -
 22
22 -
 23
23 -
 24
24 -
 25
25 -
 26
26 -
 27
27 -
 28
28 -
 29
29 -
 30
30 -
 31
31 -
 32
32 -
 33
33 -
 34
34 -
 35
35 -
 36
36 -
 37
37 -
38
-
39
-
40
-
41
-
42
-
43
-
44
-
45
-
46
-
47
-
48
-
49
-
50
-
51
-
52
-
53
-
54
-
55
-
56
-
57
-
58
-
59
-
60
-
61
-
62
-
63
-
64
-
65
-
66
-
67
-
68
-
69
-
70
-
71
-
72
-
73
-
74
-
75
-
76
-
77
-
78
-
79
-
80
-
81
-
82
-
83
-
84
-
85
-
86
-
87
-
88
-
89
-
90
-
91
-
92
-
93
-
94
-
95
-
96
-
97
-
98
-
99
-
100
-
101
-
102
-
103
-
104
-
105
-
106
-
107
-
108
-
109
-
110
-
111
-
112
-
113
-
114
-
115
-
116
-
117
-
118
-
119
-
120
-
121
-
122
-
123
-
124
-
125
-
126
-
127
-
128
-
129
-
130
-
131
-
132
-
133
-
134
-
135
-
136
-
137
-
138
-
139
-
140
-
141
-
142
-
143
-
144
-
145
-
146
-
147
-
148
 |
 |

Performance
Vodafone Group Plc Annual Report 2010 25
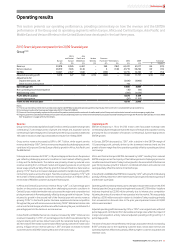
This section presents our operating performance, providing commentary on how the revenue and the EBITDA
performance of the Group and its operating segments within Europe, Africa and Central Europe, Asia Pacic and
Middle East and Verizon Wireless in the United States have developed in the last three years.
2010 nancial year compared to the 2009 nancial year
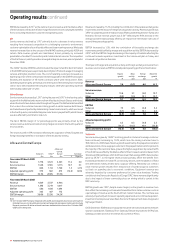
Group(1)(2)
Africa Asia
and Central Pacific and Verizon Common
Europe Europe Middle East Wireless Functions(3) Eliminations 2010 2009 % change
£m £m £m £m £m £m £m £m £Organic(4)
Revenue 29,878 8,026 6,481 – 269 (182) 44,472 41,017 8.4 (2.3)
Service revenue 28,310 7,4 05 6,146 – 6 (148) 41,719 38,294 8.9 (1.6)
EBITDA 10,927 2,327 1,840 – (359) – 14,735 14,490 1.7 (7.4)
Adjusted operating profit 6,918 527 358 4,112 (449) – 11,466 11,757 (2.5) (7.0)
Adjustments for:
Impairment losses, net (2,100) (5,900)
Other income and expense 114 −
Operating profit 9,480 5,857
Non-operating income and expense (10) (44)
Net financing costs (796) (1,624)
Profit before taxation 8,674 4,189
Income tax expense (56) (1,109)
Profit for the financial year 8,618 3,080
Notes:
(1) The Group revised how it determines and discloses segmental EBITDA and adjusted operating profit during the year. See note 3 to the consolidated financial statements.
(2) Current year results reflect average exchange rates of £1:€1.13 and £1:US$1.60.
(3) Common Functions primarily represents the results of the partner markets and the net result of unallocated central Group costs and excludes income from intercompany royalty fees.
(4) Organic growth includes India and Vodacom (except the results of Gateway) at the current level of ownership but excludes Australia following the merger with Hutchison 3G Australia on 9 June 2009.
See “Acquisitions” on page 42 for further details.
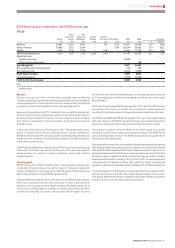
Revenue
Group revenue increased by 8.4% to £44,472 million, with favourable exchange rates
contributing 5.7 percentage points of growth and merger and acquisition activity
contributing 5.0 percentage points. During the year the Group acquired an additional
15% stake in Vodacom and fully consolidated its results from 18 May 2009.
Group service revenue increased by 8.9% to £41.7 billion, while organic service
revenue declined by 1.6%(*). Service revenue was impacted by challenging economic
conditions in Europe and Central Europe offset by growth in Africa, Asia Pacific and
the Middle East.
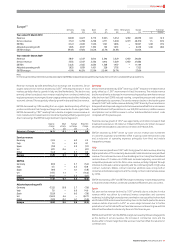
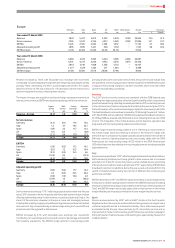
In Europe service revenue fell 3.5%(*), a 1.8 percentage point decline on the previous
year reflecting challenging economic conditions in most markets offset by growth
in Italy and the Netherlands. The decline was primarily driven by reduced voice
revenue resulting from continued market and regulatory pressure on pricing and
slower usage growth partially offset by growth in data and fixed line. Data revenue
grew by 17.7%(*) due to an increase in data plans sold with smartphones and good PC
connectivity revenue across the region. Fixed line revenue increased by 7.7%(*) with
the number of fixed broadband customers reaching 5.4 million at 31 March 2010, a
net increase of 960,000 customers during the financial year.
In Africa and Central Europe service revenue fell by 1.2%(*), a 4.3 percentage point
decline on the previous year resulting from challenging economic conditions in
Central Europe, mobile termination rate cuts across the region and competition led
pricing movements in Romania partially offset by strong growth in Vodacom. Turkey
returned to growth in the second half of the financial year with service revenue
growing 31.3%(*) in the fourth quarter. Romania experienced intense competition
throughout the year with service revenue declining 19.9%(*). Mobile termination rate
cuts across Central Europe, which became effective during the year, contributed 3.4
percentage points to the decline in service revenue.
In Asia Pacific and Middle East service revenue increased by 9.8%(*). India’s service
revenue increased by 14.7%(*), 4.7 percentage points of which was delivered by the
network sharing joint venture Indus Towers with the remainder being driven by a
46.7% increase in the mobile customer base offset in part by a decline in mobile voice
pricing. In Egypt service revenue grew by 1.3%(*) and Qatar increased its mobile
customer base to 465,000, following the launch of services in July.
Operating profit
EBITDA increased by 1.7% to £14,735 million, with favourable exchange rates
contributing 5.8 percentage points and the impact of merger and acquisition activity,
primarily the full consolidation of Vodacom, contributing 3.3 percentage points to
EBITDA growth.
In Europe, EBITDA decreased by 7.3%(*), with a decline in the EBITDA margin of
1.0 percentage point, primarily driven by the downward revenue trend and the
growth of lower margin fixed line operations partially offset by operating and direct
cost savings.
Africa and Central Europe’s EBITDA decreased by 5.8%(*) resulting from reduced
EBITDA margins across the majority of Central Europe due to challenging economic
conditions and investment in Turkey to drive growth in the second half of the financial
year. Strong revenue growth in Vodacom, combined with direct and customer cost
savings partially offset the decline in Central Europe.
In Asia Pacific and Middle East EBITDA increased by 1.4%(*), with growth in India being
partially offset by declines in other markets due to pricing and recessionary pressure
and the start-up in Qatar.
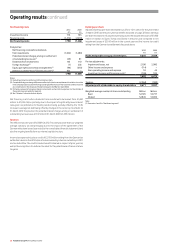
Operating profit increased primarily due to changes in impairment losses. In the 2010
financial year, the Group recorded net impairment losses of £2,100 million. Vodafone
India was impaired by £2,300 million primarily due to intense price competition
following the entry of a number of new operators into the market. This was partially
offset by a £200 million reversal in relation to Vodafone Turkey resulting primarily
from movements in discount rates. In the prior year impairment losses of £5,900
million were recorded.
Adjusted operating profit decreased by 2.5%, or 7.0%(*) on an organic basis, with a 6.0
percentage point contribution from favourable exchange rates, whilst the impact of
merger and acquisition activity reduced adjusted operating profit growth by 1.5
percentage points.
The share of results in Verizon Wireless, the Group’s associate in the US, increased by
8.0%(*) primarily due to the expanding customer base, robust data revenue and
operating expenses efficiencies partially offset by higher customer acquisition and
retention costs.
Operating results