Samsung 2005 Annual Report Download - page 88
Download and view the complete annual report
Please find page 88 of the 2005 Samsung annual report below. You can navigate through the pages in the report by either clicking on the pages listed below, or by using the keyword search tool below to find specific information within the annual report.-
 1
1 -
2
-
3
-
4
-
5
-
6
-
7
-
8
-
9
-
10
-
11
-
12
-
13
-
14
-
15
-
16
-
17
-
18
-
19
-
20
-
21
-
22
-
23
-
24
-
25
-
26
-
27
-
28
-
29
-
30
-
31
-
32
-
33
-
34
-
35
-
36
-
37
-
38
-
39
-
40
-
41
-
42
-
43
-
44
-
45
-
46
-
47
-
48
-
49
-
50
-
51
-
52
-
53
-
54
-
55
-
56
-
57
-
58
-
59
-
60
-
61
-
62
-
63
-
64
-
65
-
66
-
67
-
68
-
69
-
70
-
71
-
72
-
73
-
74
-
75
-
76
-
77
-
 78
78 -
 79
79 -
 80
80 -
 81
81 -
 82
82 -
 83
83 -
 84
84 -
 85
85 -
 86
86 -
 87
87 -
 88
88 -
 89
89 -
 90
90 -
 91
91 -
 92
92 -
 93
93 -
 94
94 -
 95
95 -
 96
96 -
 97
97 -
 98
98 -
99
-
100
-
101
-
102
-
103
-
104
-
105
-
106
-
107
-
108
-
109
-
110
-
111
-
112
-
113
-
114
-
115
-
116
-
117
-
118
-
119
-
120
-
121
-
122
-
123
-
124
-
125
-
126
-
127
-
128
-
129
-
130
-
131
-
132
-
133
-
134
-
135
-
136
-
137
-
138
-
139
-
140
-
141
-
142
-
143
-
144
-
145
-
146
-
147
-
148
 |
 |

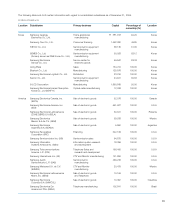
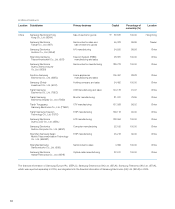
86
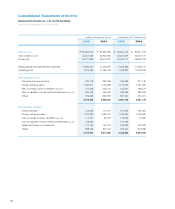
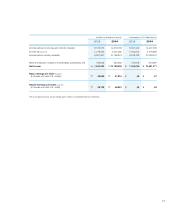
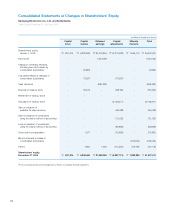
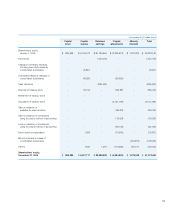
(in millions of Korean won)
Location Subsidiaries Primary business Capital Percentage of
ownership (%)
Location
Europe /
Africa
Samsung Electronics
Iberia, S.A. (SESA)
VCR, TVCR
manufacturing and sales
\ 87,473 100.00 Spain
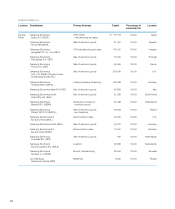
Samsung Electronics
Nordic AB (SENA)
Sale of electronic goods 21,057 100.00 Sweden
Samsung Electronics
Hungarian RT. Co., Ltd. (SEH)
CTV manufacturing and sales 170,015 100.00 Hungary
Samsung Electronica
Portuguesa S.A. (SEP)
Sale of electronic goods 18,302 100.00 Portugal
Samsung Electronics
France S.A. (SEF)
Sale of electronic goods 65,945 100.00 France
Samsung Electronics
(UK), Ltd. (SEUK) (formerly known
as Samsung Europe Plc.)
Sale of electronic goods 234,196 100.00 U.K.
Samsung Electronics
Holding GmbH (SEHG)
Holding Company (Financing) 148,098 100.00 Germany
Samsung Electronics Italia S.P.A (SEI) Sale of electronic goods 60,856 100.00 Italy
Samsung Electronics South
Africa (Pty) Ltd. (SSA)
Sale of electronic goods 21,586 100.00 South Africa
Samsung Electronics
Benelux B.V. (SEBN)
Distribution and sale of
electronic goods
32,368 100.00 Netherlands
Samsung Electronics
Poland, SP.ZO.O (SEPOL)
Sale of electronic goods
and telephone
28,548 100.00 Poland
Samsung Semiconductor
Europe Limited (SSEL)
Semiconductor sales 45,034 100.00 U.K.
Samsung Electronics Gmbh (SEG) Sale of electronic goods 54,270 100.00 Germany
Samsung Semiconductor
Europe Gmbh (SSEG)
Semiconductor sales 10,947 100.00 Germany
Samsung Electronics
Overseas B.V. (SEO)
Sale of electronic goods 915 100.00 Netherlands
Samsung Electronics
Europe Logistics B.V. (SELS)
Logistics 29,836 100.00 Netherlands
Samsung Electronics
Slovakia s.r.o (SESK)
Monitor manufacturing 95,264 100.00 Slovakia
LLC Samsung
Electronics, Russia (SER)
Marketing 6,055 100.00 Russia
\